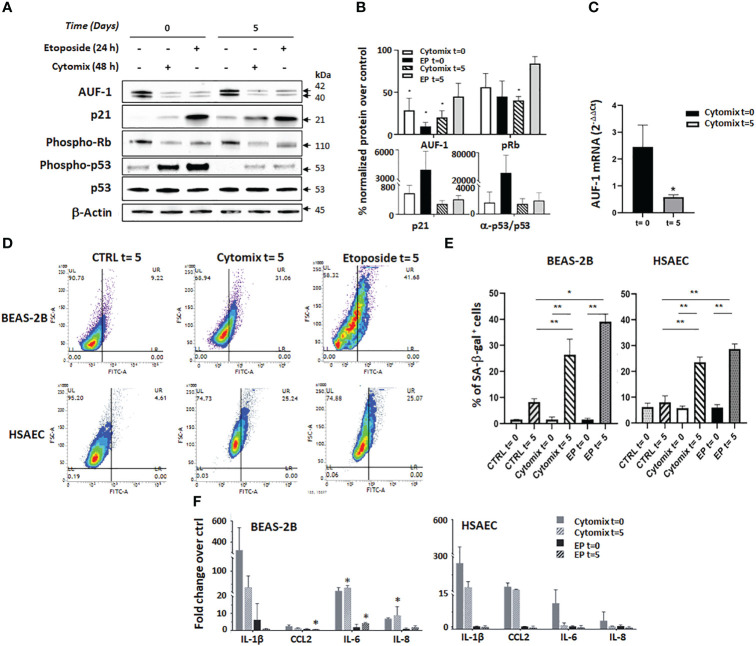
Figure 4.
AUF-1 loss and cellular senescence in BEAS-2B and HSAEC upon cytomix stimulation. (A, B) Representative immunoblots (A) and densitometric analysis (B) of AUF-1, phospho-retinoblastoma (p-Rb) protein, p21, p53 and phospho-p53 after prolonged cell culture for senescence assays. BEAS-2B cell lysates were harvested after 48 h in resting or cytomix-stimulated conditions, or after 24 h etoposide stimulation (6 µM, as control inducer of senescence), as post-treatment time 0 and after additional 5 days of unstimulated cultures (as post-treatment time 5). β-actin was used as the loading control (mean ± SEM of n=3). *p<0,05 compared to corresponding unstimulated control. (C) qRT-PCR analysis of AUF-1 mRNA from BEAS-2B cells at time 0 and time 5 (mean ± SEM of n=3). mRNA levels were normalized to housekeeping mRNA levels (GAPDH) and expressed as fold change over unstimulated cells as 2-ΔΔCt. (D, E). Representative contour plots of SA-β-gal activity (D) in BEAS-2B cells (upper panels) and HSAEC cells (lower panels). (E) Relative mean MFI upon cytomix stimulation for 48 h or etoposide for 24 h (mean ± SEM of n=3). After stimulation, the culture media was replaced with no further stimulation and cells were incubated (37°C, 5 days). (F) Detection of SASP –related cytokines in BEAS-2B (left panel, mean ± SEM of n=3) and HSAEC (right panel, mean ± SEM of n=2) supernatants upon indicated conditions. Cytokine levels are represented as fold change of mean fluorescence intensity over values in unstimulated (control) cell supernatants. *p<0,05, **p<0,01 vs corresponding control.

