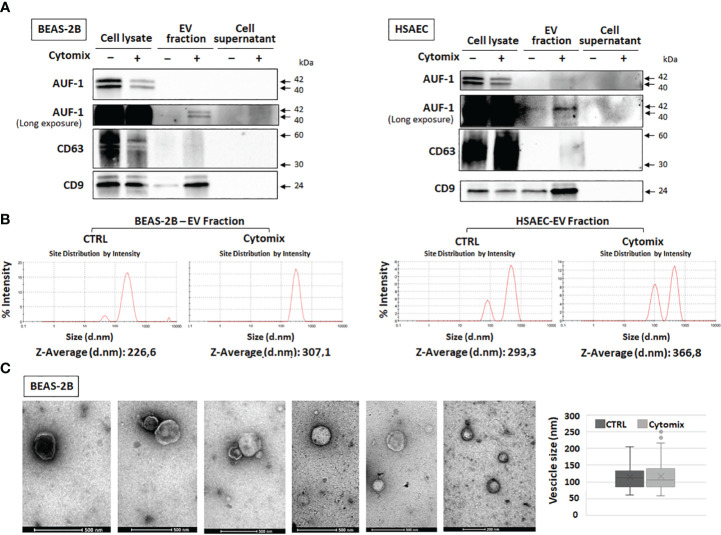
Figure 5.
Detection of AUF-1 in extracellular vesicles (EVs) from cytomix-stimulated BEAS-2B and HSAEC. (A) Representative immunoblots (n=3) of AUF-1 in whole cell lysates, EV fractions and remaining supernatants (as EV isolation control) obtained by differential centrifugation of culture media of BEAS-2B (left panel) and primary HSAEC cells (right panel) in the indicated conditions, showing cytomix-induced changes in AUF-1 cellular and extracellular fractions. CD63 and CD9 were used as markers for EVs. (B) Dynamic light scattering (DLS) analysis showing the average size of EVs isolated from resting and cytomix-treated BEAS-2B (left panels) and HSAEC (right panels). (C) Representative transmission electron microscopy (TEM) images of EVs isolated from BEAS-2B cells; graph shows mean ± SD EVs size in experimental conditions. Scale bars are shown.

