
Figure 7.
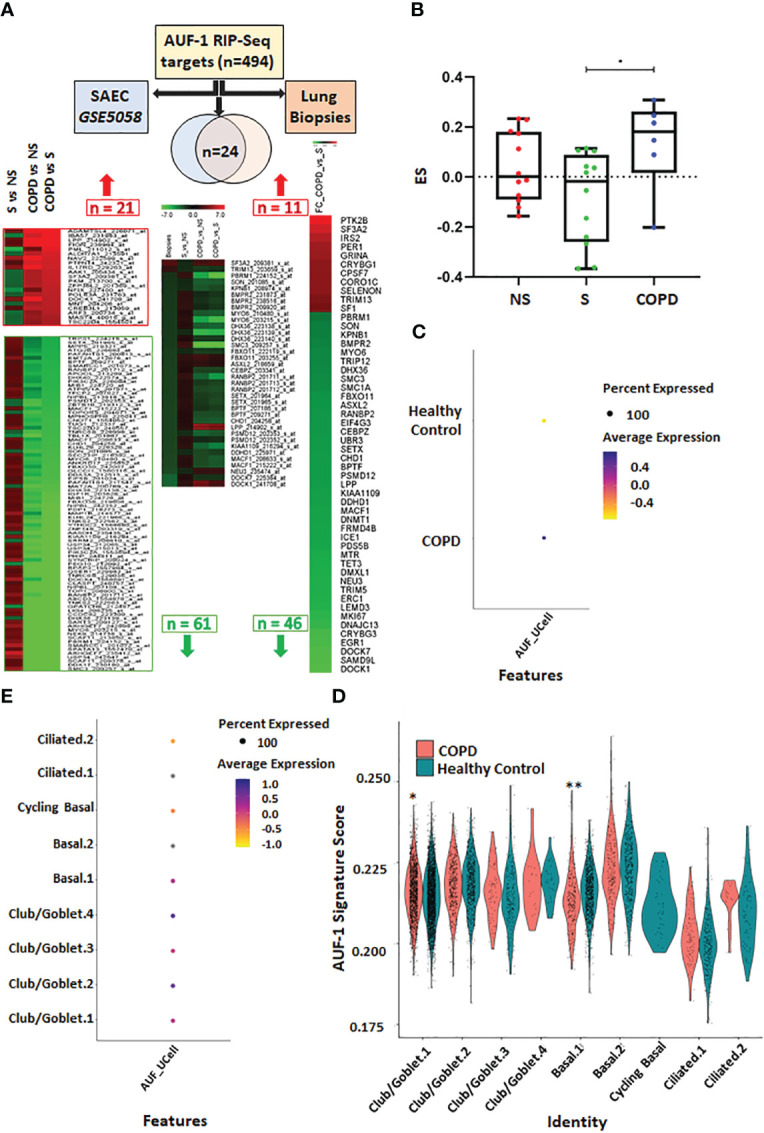
Analysis of AUF-1-bound transcript pool expression in transcriptomic databases of small airway/broncho-epithelium, lung biopsies and of single cell RNA-sequencing (scRNA-Seq) of COPD. (A) Analysis of AUF-1 target expression identified by RIP-Seq (n=494) in small airway epithelial cell (SAEC) gene array database GSE5058 (left-pointing arrow) (full list in Table S5 ) and in RNA sequencing database of lung biopsies of COPD vs smokers with NLF (right-pointing arrow) (full list in Table S6 ). For GSE5058 data: heatmap showing probes, indicated with Gene name and Probe ID, of 21 upregulated and 66 downregulated AUF-1 targets identified as DEG (FC ≥ |2.0|, FDR ≤ 0.5) in COPD vs smoker controls with differential expression in (left to right): smokers vs non-smoker controls; COPD vs non-smokers; COPD vs smoker controls. For lung biopsies data: heatmap showing FC of 57 AUF-1 targets, identified as DEG (log2FC ≥ |0.40|, FDR ≤ 0.5) in COPD vs smoker controls. Central arrow down: Venn diagram indicating overlap of n=24 AUF-1 targets shared by the two databases and heatmap showing relative expression. (B) Gene signatures identified by GSVA in GSE5058 dataset showing the enrichment score (ES) of the AUF-1 transcript targets (EF≥2 and FDR ≤ 0.05) in non-smokers (NS), smokers (S) and chronic obstructive pulmonary disease (COPD) patients. *p ≤ 0.05(Student’s t-test). (C, D) Signature plots of global (C) and cell-specific (D) average expression of AUF-1 signature, *p ≤ 0.005, ≤ 0.000005** (Student’s t-test). (E) Expression of AUF-1 signatures in individual broncho-epithelial cell types, all generated from scRNAseq datasets of primary broncho-epithelial cells from stable COPD patients and healthy controls differentiated at the air-liquid-interface (82).