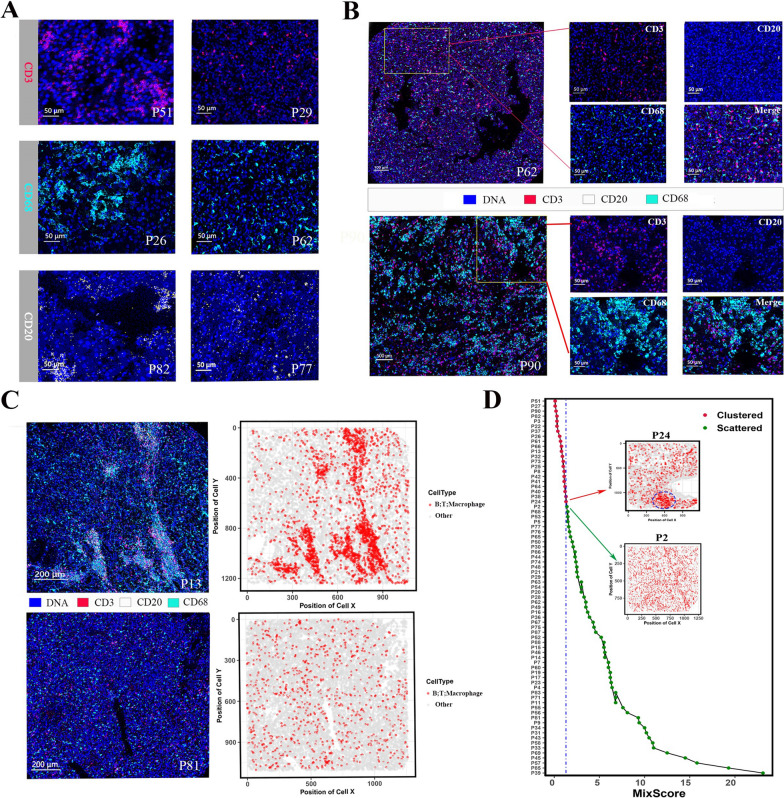
Fig. 3.
The immune cell distributions in the ccRCC tissues exhibited scattered and clustered status. A Representative IMC images depicting the clustered and scattered distributions of T cells (CD3), macrophages (CD68) and B cells (CD20). Clustered architecture in P51, P26 and P82 vs scattered architecture in P29, P62 and P77. B Representative IMC images illustrating the ccRCC tissues with scattered (Top panel: P62) and clustered (Bottom panel: P90) immune architectures. C IMC images and corresponding cell distribution maps of ccRCC tissues. Top panel: clustered architecture, P13; Bottom panel: scattered architecture, P81. D Mix score of each ccRCC tissues. The mix scores of P24 and P2 in the cohort were set as the thresholds of clustered and scattered immune architectures, respectively

