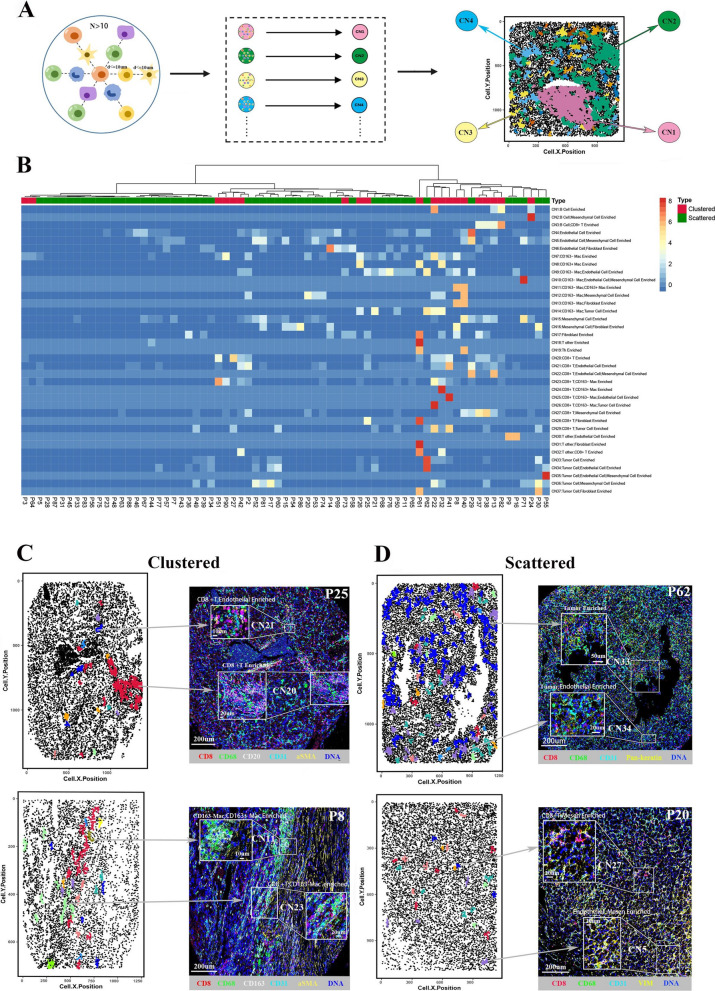
Fig. 4.
Cellular Neighborhood (CN) analysis reflect the cell communities within the ccRCC tissues. A Analysis schedule of CN. The topology of IMC image was represented by categorical dot plot with different colors indicating various CNs. B Heatmap showing the number of CNs across various ccRCC tissues. The numbers were normalized by z-score for visualization. C Categorical dot plots and corresponding IMC images of representative tissues with clustered immune architecture. Top: P25; Bottom: P8. D Categorical dot plots and corresponding IMC images of representative tissues with scattered immune architecture. Top: P62; Bottom: P20

