
Figure 1.
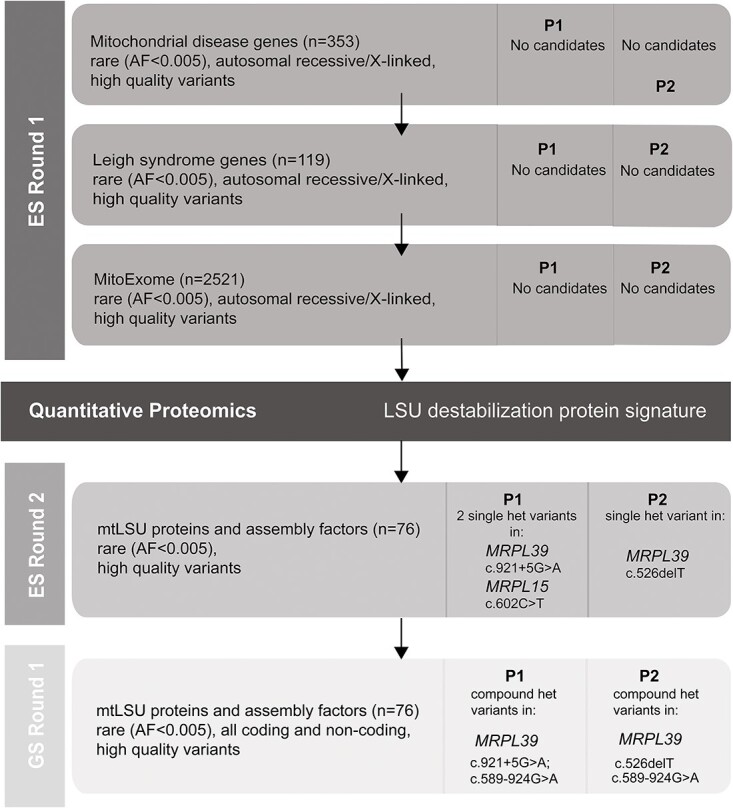
Flowchart illustrating the filtering strategy and chronological steps used to analyze exome and genome sequencing data for P1 and P2. Each horizontal bar represents a step in the analysis process based on the gene list used and contains information on the filter parameters used and the details of any candidate genes (gene, inheritance, variant) identified for P1 and P2. The vertical columns indicate whether exome (ES) or genome (GS) sequence was utilized. The black horizontal bar represents the stage at which quantitative proteomics was used to identify candidate disease genes. MitoExome refers to genes encoding all known and candidate proteins targeted to the mitochondria primarily based on the MitoCarta3.0 inventory (72). AF: allele frequency.