Figure 2.

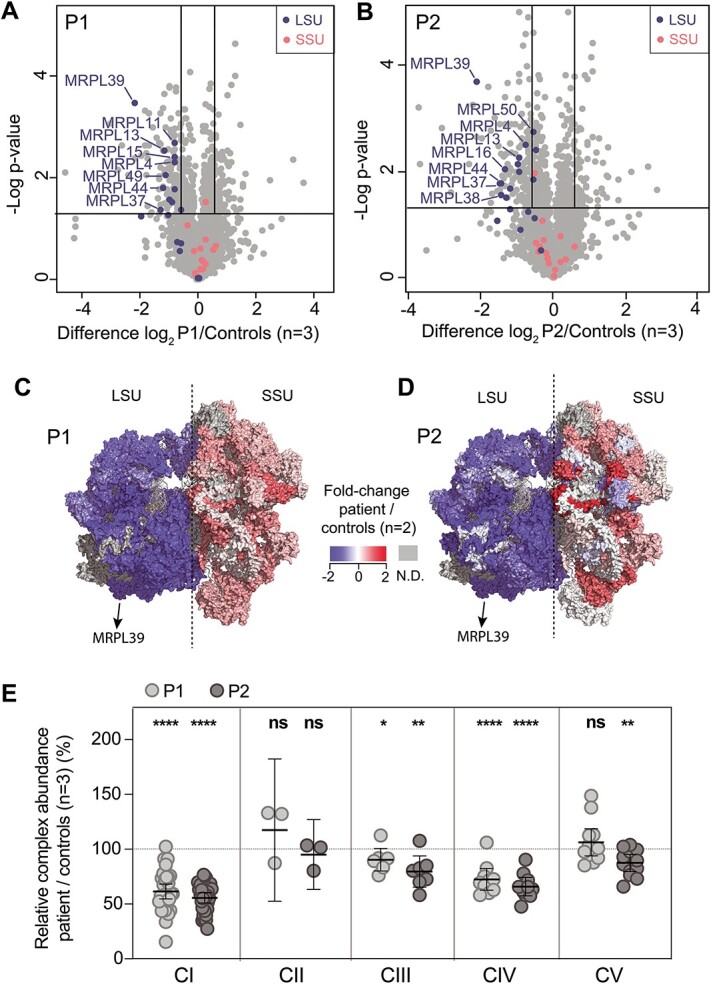
Quantitative proteomics identifies the decreased abundance of the large subunit of the mitoribosome and OXPHOS complexes in P1 and P2 fibroblasts. Volcano plot of label-free quantitative proteomics data from whole-cell fibroblasts from (A) P1, and (B) P2, depicting a specific decrease in the relative abundance of proteins of the large ribosomal subunit (LSU) in both cell lines compared to controls. mtLSU = large ribosomal subunit, mtSSU = small ribosomal subunit. The horizontal lines in A and B represent p = 0.05 and the vertical lines represent an equivalent fold-change of ±1.5. Topographical heat mapping of label-free quantitative proteomics data from isolated mitochondria in (C) P1, and (D) P2, relative to controls (n = 2) utilizing the cryo-electron microscopy structure of the mitoribosome (6) PDB: 3J9M), N.D. = not detected. (E) RCA analysis of OXPHOS complexes from whole-cell quantitative proteomics for P1 and P2 relative to controls (n = 3). The middle bar represents the mean value for the complex, whereas the upper and lower bars represent the 95% confidence interval of the mean value. Each dot represents a single protein. * = p < 0.05, ** = p < 0.01, **** = p < 0.0001 and ns = not significant represent P-value significances from paired t-test. CI = Complex I, CII = Complex II, CIII = Complex III, CIV = Complex IV, CV = Complex V.
