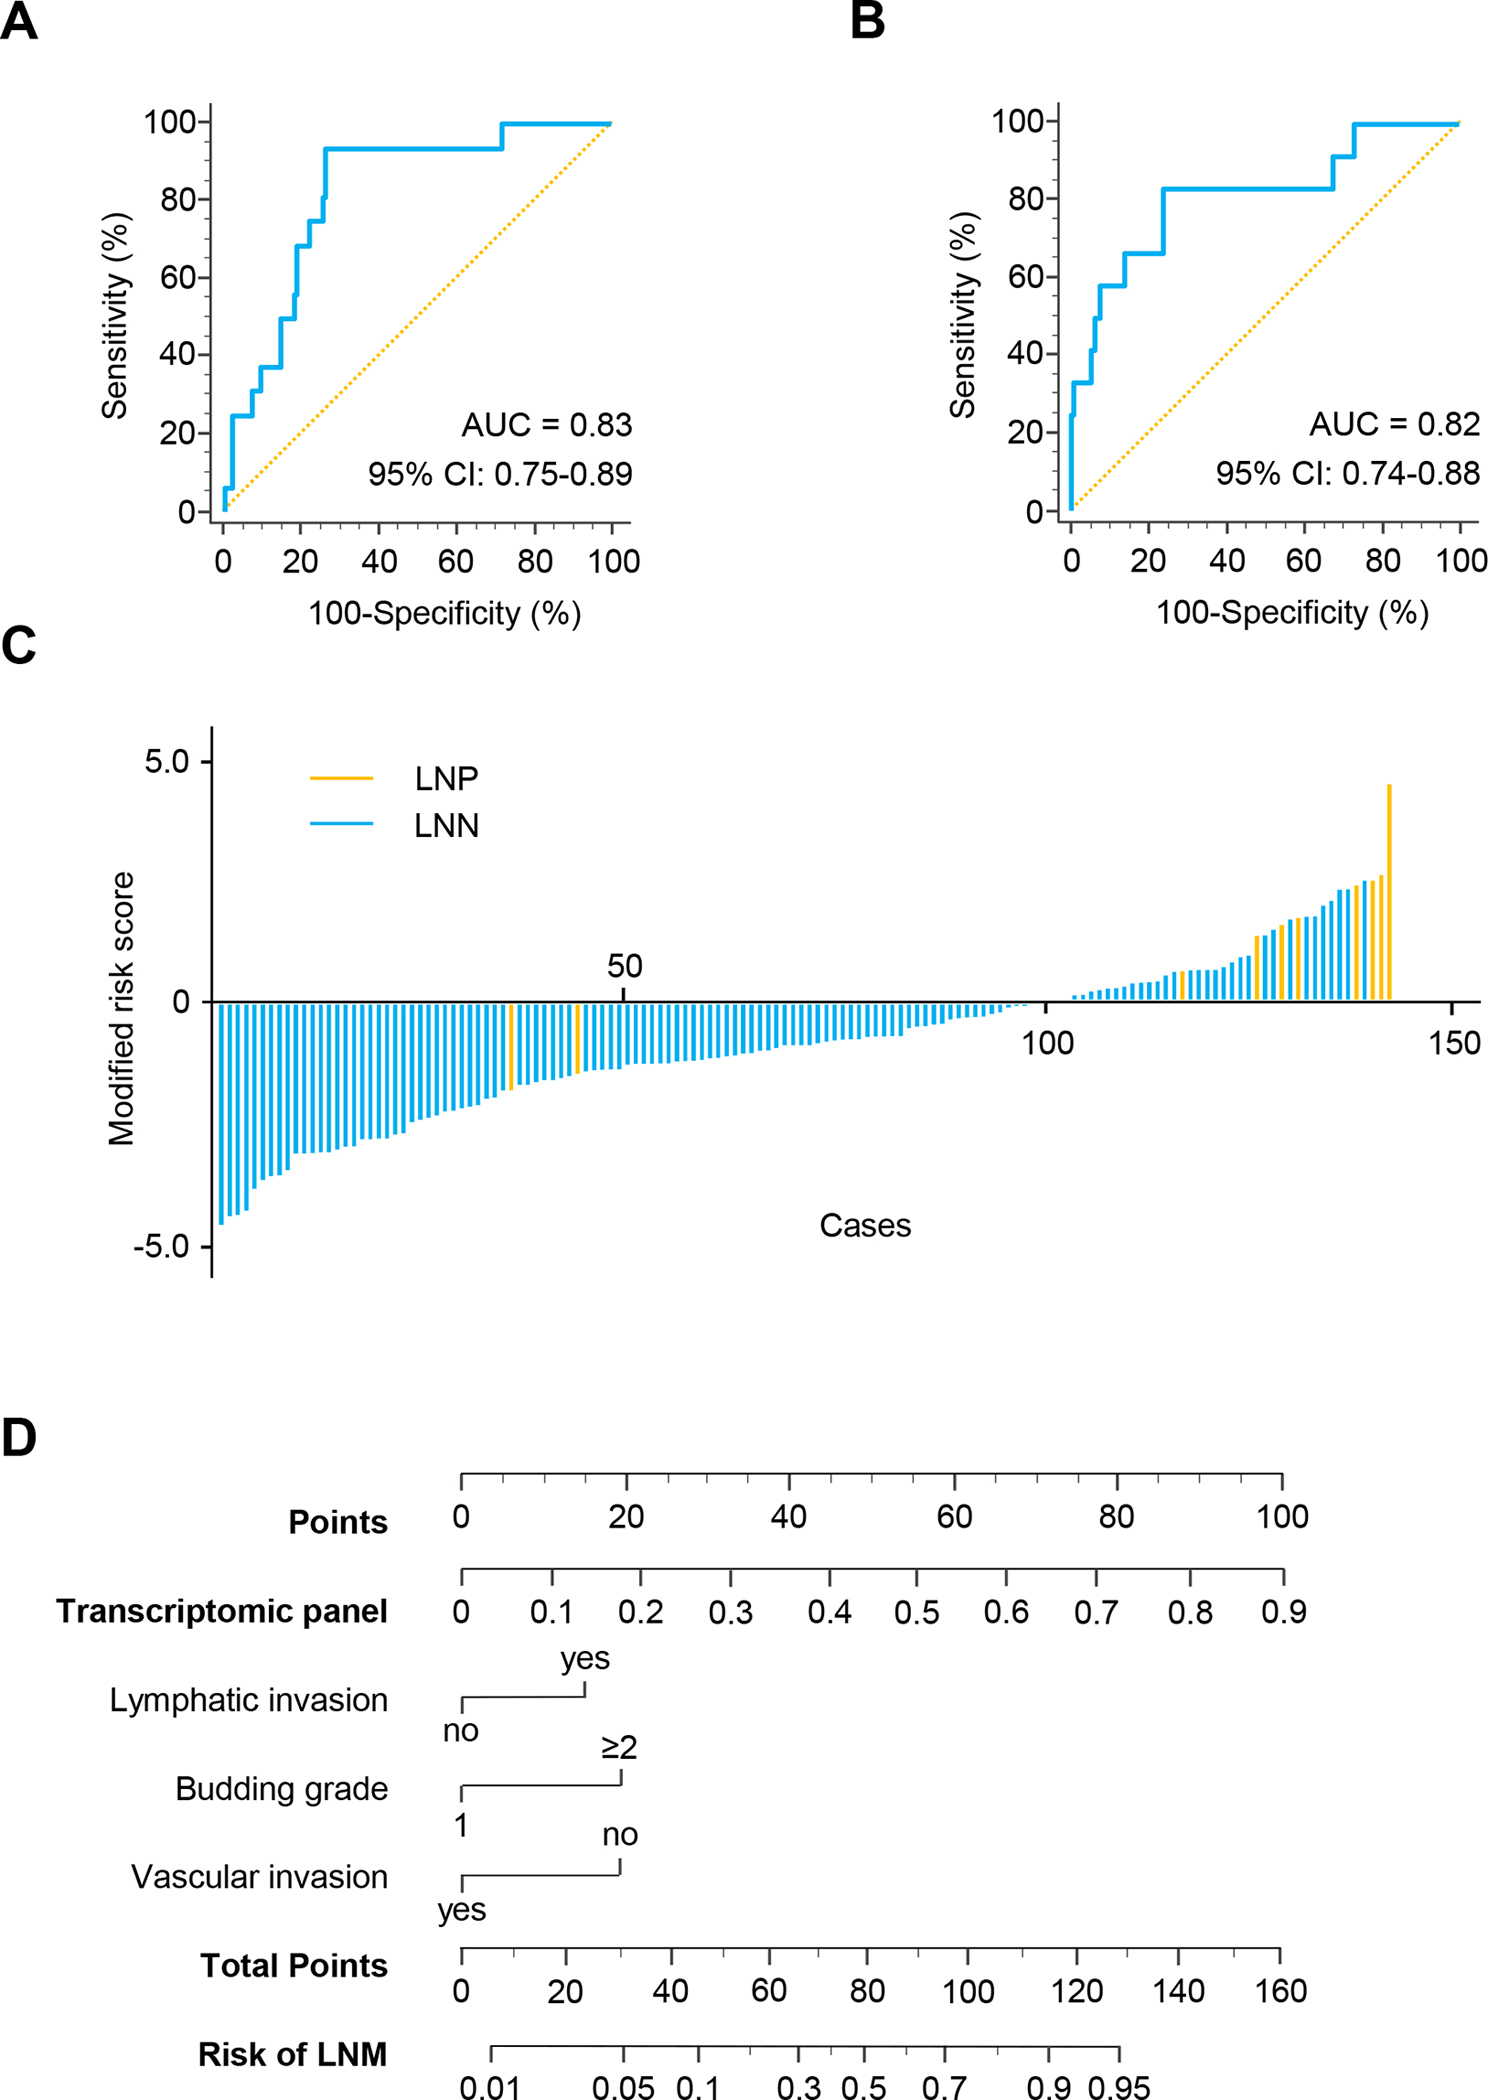
Figure 2.

Validation phase of the transcriptomic panel for the identification of LNM in patients with T1 CRC. A) A ROC curve for the transcriptomic panel in tissue specimens from validation cohort patients (LNP = 12, LNN = 130, AUC = 0.83). B) A ROC curve for the transcriptomic panel in matched serum samples in validation cohort patients (LNP = 12, LNN = 130, AUC = 0.82). C) Risk score distribution plot in serum specimens from validation cohort patients. D) A nomogram illustrating the probability of LNM risk. For clinical purposes, the scores of each covariate are added, and the total score is depicted on the total score point axis.
