
Figure 2.
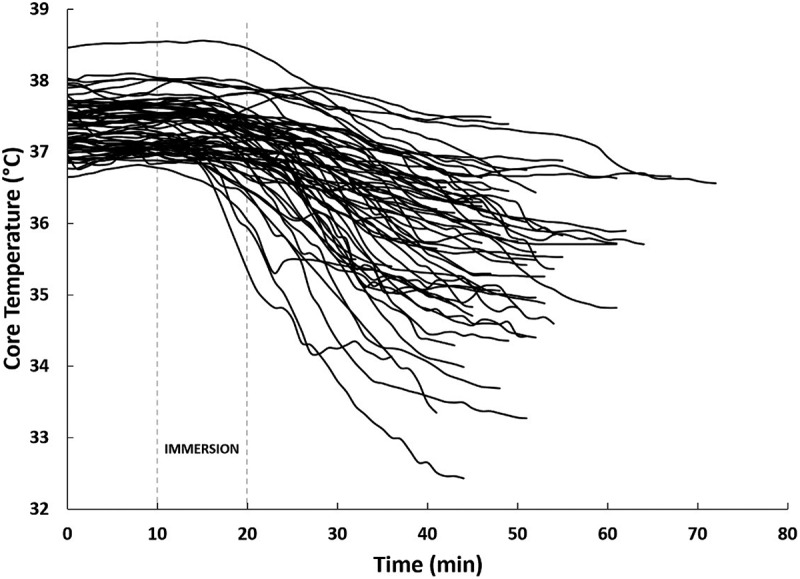
Continuous Tc data (recorded and displayed each minute) from the start of training exercises (i.e. before immersion) to their lowest Tc recorded. The data displayed are only a subset (n = 66) of all participants and demonstrate the significant variability in Tc response to 10-min CWI. Note that Figure 3 calculates hypothermia onset time from the start of immersion (which is displayed as Minute 10 in this figure).