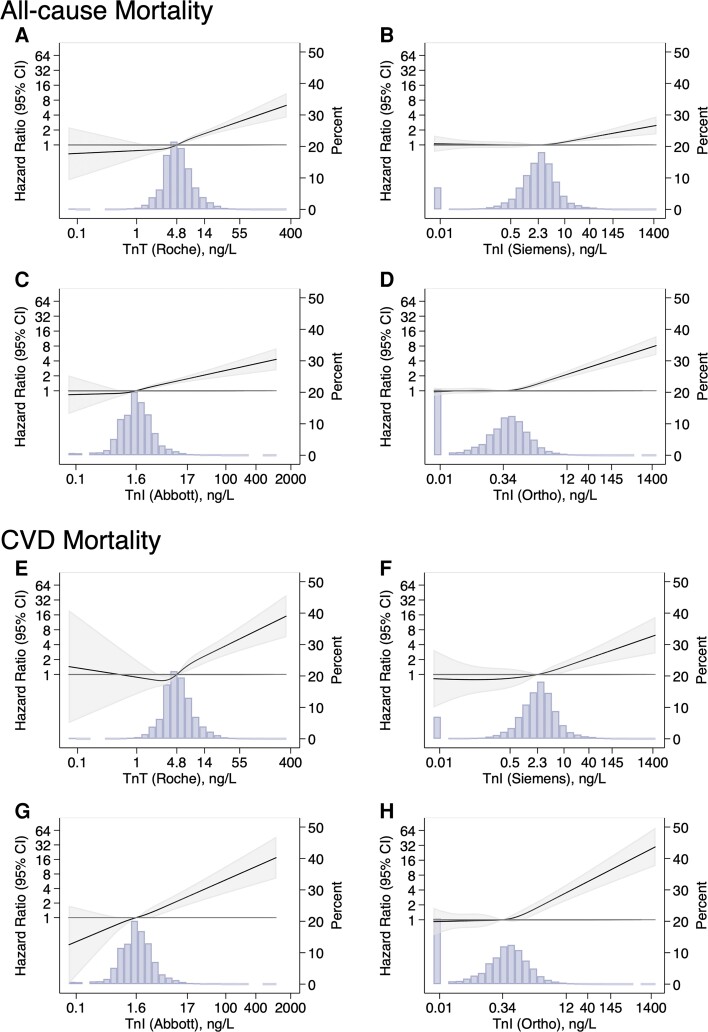
Figure 1.
Hazard ratios (95% confidence intervals) for four high-sensitivity troponin assays with all-cause mortality (panel A, high-sensitivity troponin T, Roche; panel B, high-sensitivity troponin I, Siemens; panel C, high-sensitivity troponin I, Abbott; panel D, high-sensitivity troponin I, Ortho) and cardiovascular disease mortality (panel E, high-sensitivity troponin T, Roche; panel F, high-sensitivity troponin I, Siemens; panel G, high-sensitivity troponin I, Abbott; panel H, high-sensitivity troponin I, Ortho) among US adults without a history of cardiovascular disease, NHANES 1999–2004. High-sensitivity troponin was log-transformed and modeled as a restricted cubic spline (solid line). Knots were placed at 5th, 35th, 65th, 95th, percentiles. The shaded areas on each side of the regression line are the 95% confidence intervals. The background shaded area is the distribution (histogram) of each high-sensitivity troponin assay in the population. The models were adjusted for age, sex, race/ethnicity, total cholesterol, high-density lipoprotein cholesterol, systolic blood pressure, cigarette smoking status, diabetes mellitus, family history of cardiovascular disease, body mass index, use of blood pressure medications, use of cholesterol-lowering medications, and estimated glomerular filtration ratio. CI, confidence interval; CVD, cardiovascular disease; Tn, troponin.

