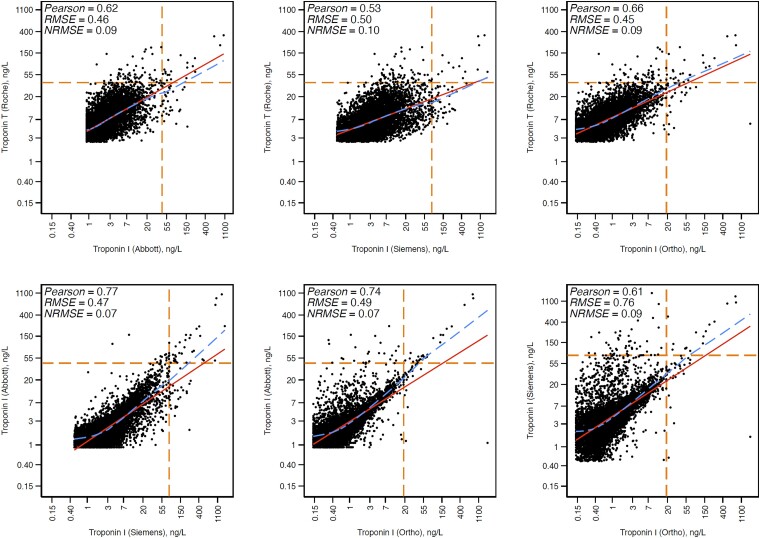
Figure 2.
Unweighted pairwise correlations between log-transformed high-sensitivity troponin assays among primary prevention US adults aged 18 or older with concentrations above the assay limit of blank, NHANES 1999–2004. Unweighted Scatterplots. Non-linear dashed line, locally weighted scatterplot smoothing; straight unbroken line, linear regression; horizontal and vertical intersecting dashed lines, 99th percentile of troponin in the analytic sample. Participants with high-sensitivity troponin concentrations below the limit of blank for each assay were excluded from correlation analyses. RMSE, root mean square error; NRMSE, normalized root mean square error.

