
Figure 5.
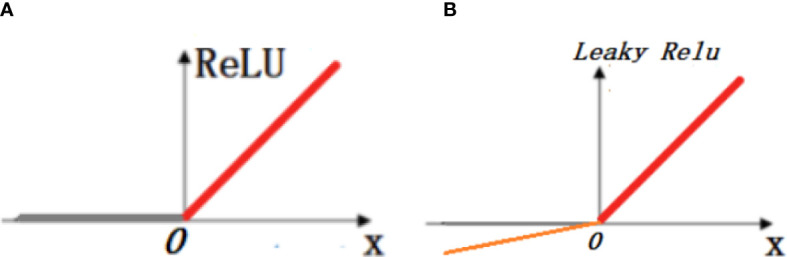
Plot of ReLU and Leaky ReLU activation functions. In the figure, (A) shows the linear representation of the ReLU activation function and (B) shows the linear representation of the Leaky ReLU activation function.
Official websites use .gov
A
.gov website belongs to an official
government organization in the United States.
Secure .gov websites use HTTPS
A lock (
) or https:// means you've safely
connected to the .gov website. Share sensitive
information only on official, secure websites.
Plot of ReLU and Leaky ReLU activation functions. In the figure, (A) shows the linear representation of the ReLU activation function and (B) shows the linear representation of the Leaky ReLU activation function.