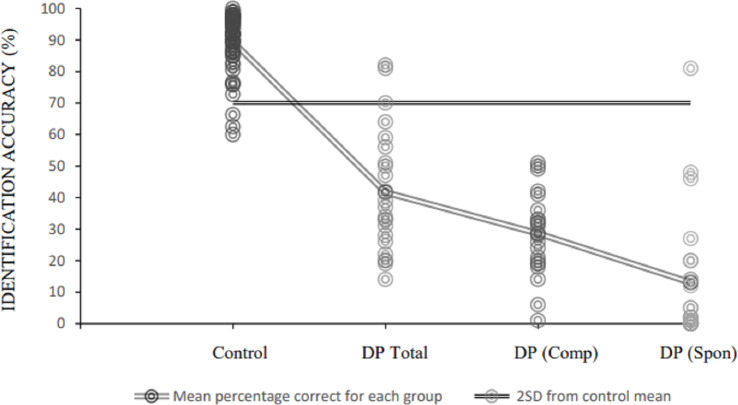
Figure 4. Accurate famous face identification percentages for control and DP participants.
Individual DP accuracy rates are plotted according to (A) total correct identifications, (B) correct identifications attributed to compensatory mechanisms, only, and (C) correct identifications achieved spontaneously. Trend lines indicate (A) average identification accuracy, per group (dark grey), and (B) two standard deviations below the control mean of 71.20% (black).

