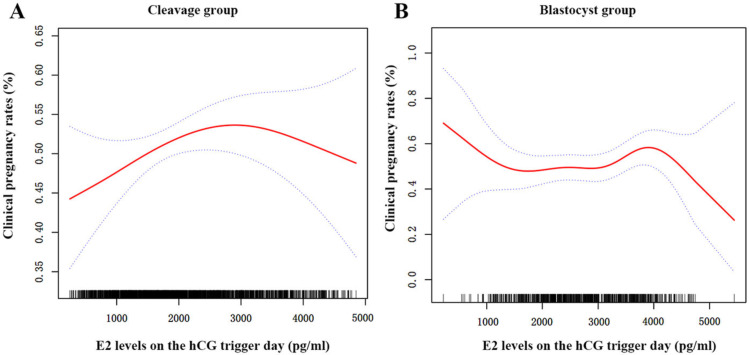
Figure 2. The curvilinear relationship between CPR and E2 levels on hCG trigger day in two groups.
A nonlinear association between serum E2 levels on hCG trigger day and CPR of patients in the cleavage group (A) and the blastocyst group (B). The red lines represent the smoothing curve fit between serum E2 and CPR, and the blue lines represent the 95% confidence interval.

