
Figure 8.
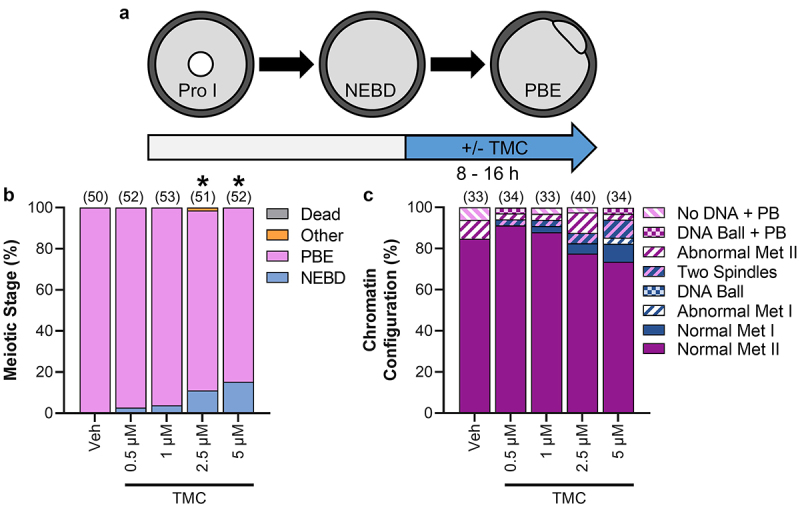
PP1 inhibition from metaphase I onwards impairs meiosis I exit, but has no impact on meiotic abnormalities. (a) Schematic representation of the experimental design. Prophase I oocytes were released from meiotic arrest into standard culture medium for 8 h before being cultured in medium containing TMC (0.5–5 µM) or vehicle control (0.1% DMSO). (b) Graphical representation of meiotic stage based on phase microscopy at 16 h into culture. Bar graph shows the percentage of oocytes at each meiotic stage. n = 50–52 oocytes over two replicates. * denotes a significant difference from Veh control oocytes (Fisher’s exact test). For the total number of oocytes at each meiotic stage see Supplemental Table 3. (c) Graphical representation of the meiotic stage and DNA morphology of oocytes at 16 h into culture. Solid colors represent normal DNA morphology for the meiotic stage, and hatched colors represent abnormal DNA morphology for the meiotic stage. n = 33–40 oocytes over two replicates.