
Figure 3.
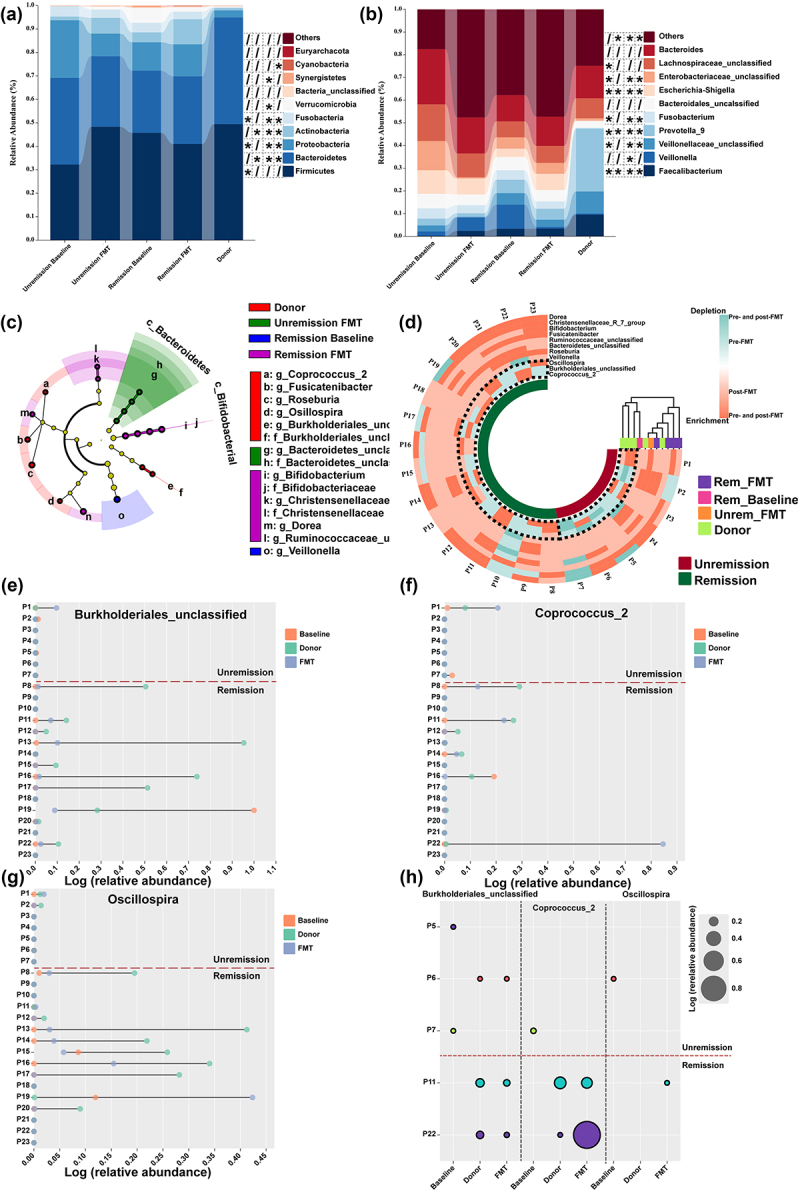
The composition of bacterial (a) phyla and (b) genera in the donor group and rCDI patient group before and after receiving FMT treatment. *Indicates a significant difference compared with the donor group (p < 0.05), and the p value was obtained by ANOVA design. (c) LEfSe cladogram presented the characteristic microbes of donors and patients with or without FMT response. (d) Heatmap showed the colonization antagonism of characteristic microbes. The relative abundance of (e) Burkholderiales_unclassified, (f) Coprococcus_2, and (g) Oscillospira in rCDI patients and their donors. (h) Five patients received enterobacteria transplantation from donor CH.