
Figure 4.
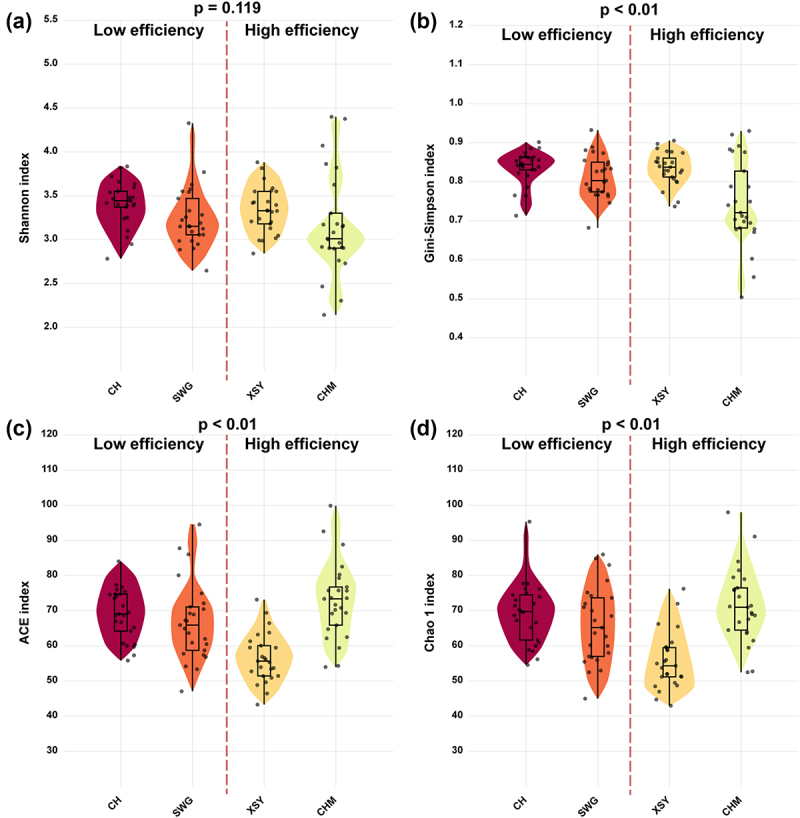
(a) Shannon index, (b) Gini-Simpson index, (c) ACE index, and (d) Chao 1 index for samples from 4 donors. Donor CH and SWG had low average FMT effectiveness levels, and XSY and CHM had high average FMT effectiveness levels. The p value was obtained by ANOVA design.