
Figure 5.
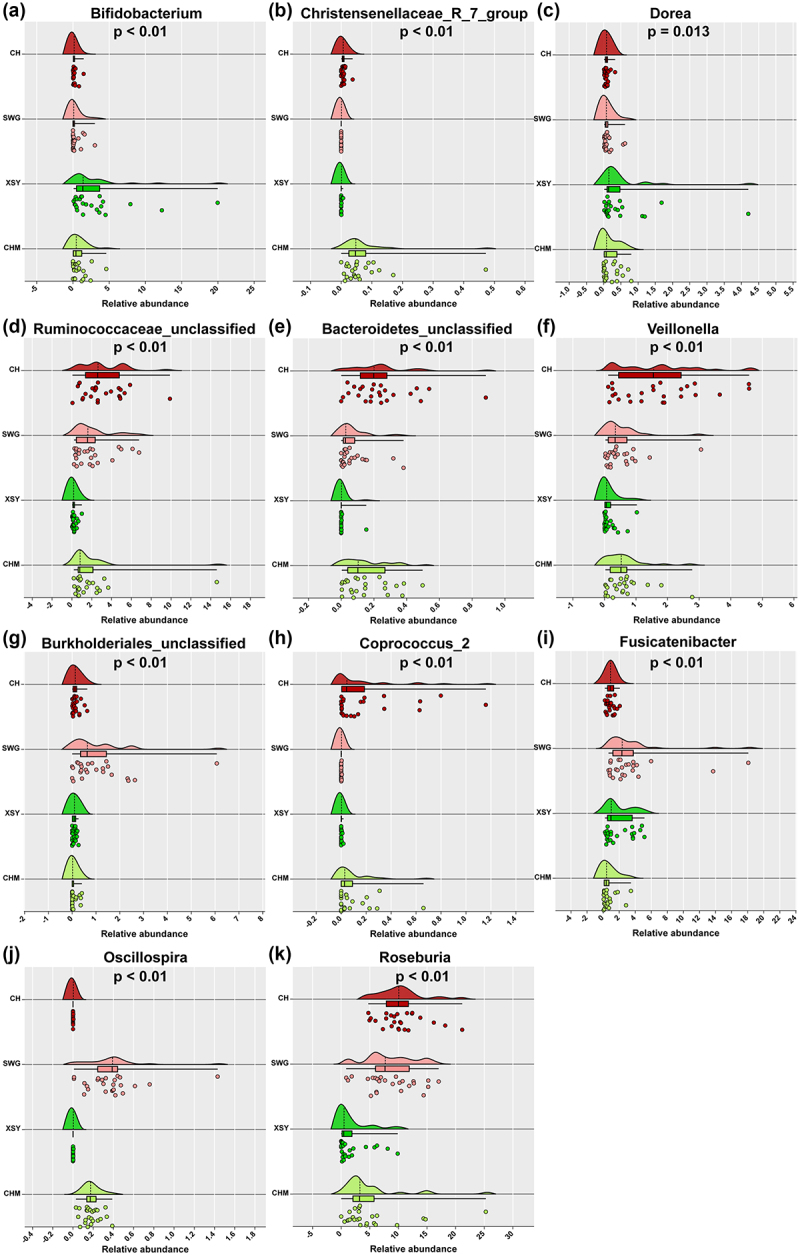
The relative abundance of (a) Bifidobacterium, (b) Christensenellaceae_r_7_group, (c) Dorea, (d) Ruminococcaceae_unclassified, (e) Bacteroidetes_unclassified, (f) Veillonella, (G) Burkholderiales_unclassified, (h) Coprococcus_2, (I) Fusicatenibacter, (j) Oscillospira, and (k) Roseburia from the four donors. The p value was obtained by ANOVA design.