
Figure 3.
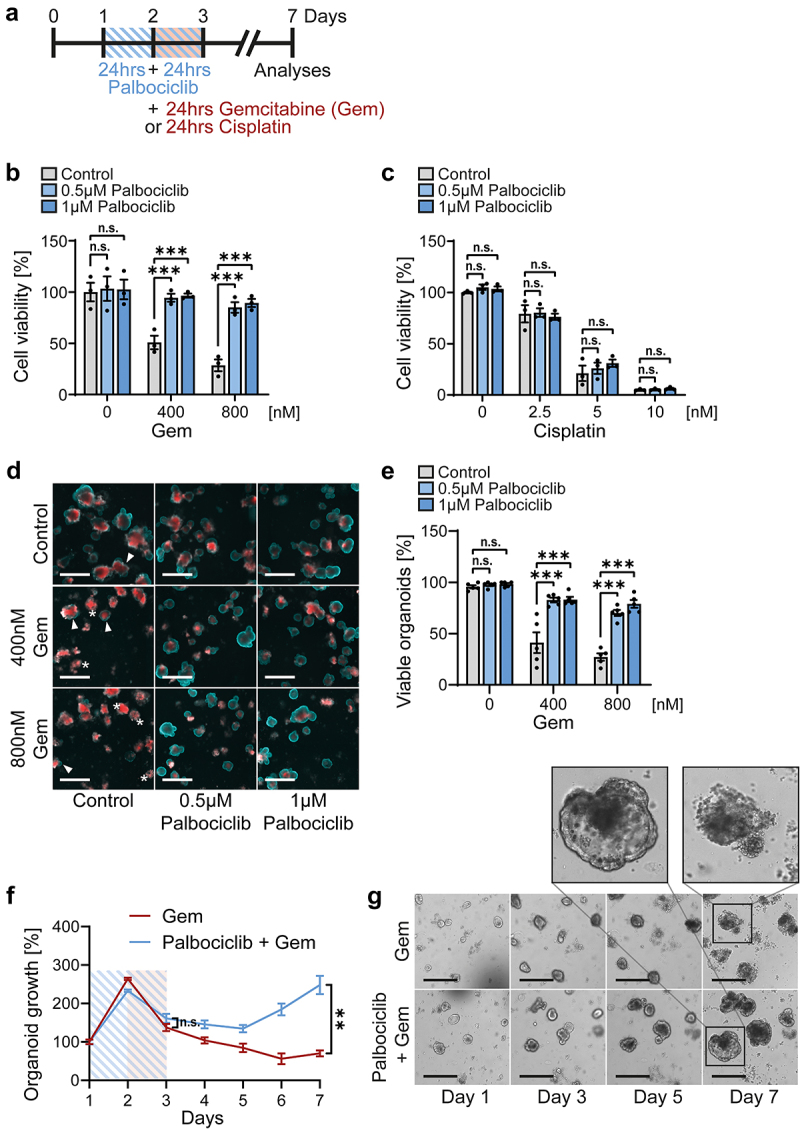
Intestinal organoids are protected against gemcitabine by CDK4/6 inhibition.
Note: a. Scheme of gemcitabine/palbociclib co-treatment of intestinal organoids. Twenty-four hours post-seeding, organoids were treated with palbociclib for 48 hrs (blue lines). For the final 24 hrs, gemcitabine (Gem) or cisplatin were added (red). On day 3, all treatments were removed, and organoids were further cultured for 4 d in their normal growth media. Analyses were performed on day 7.
b, c. Intestinal organoids were treated with gemcitabine (b) or cisplatin (c), with or without palbociclib pre-treatment, as described in a. Organoid viability was determined by CellTiter-Glo 3D assays on day 7. Mean ± SEM of three biological replicates. Untreated control (0 nM gemcitabine and 0 µM palbociclib) was set 100%. Two-way ANOVA with Dunnett’s multiple comparison test was performed to compare palbociclib pre-treated conditions to control, revealing that palbociclib provided protection against gemcitabine but not cisplatin. ***p < 0.001, n.s. not significant.
d. Representative propidium iodide (PI) and Hoechst staining to analyze organoid death. Organoids were treated as in a and, after a re-growth phase, were analyzed on day 7. Control, untreated samples. The membrane-impermeant dye propidium iodide (PI) only marks dead cells (red). The cell-permeable Hoechst dye served as counterstaining to visualize organoid structures (blue). Arrowheads indicate the accumulation of dead cells in the organoid lumen, seen as red staining in the middle of organoids, but with an intact outer epithelial barrier (blue line), showing normal organoid homeostasis representing viable organoids. Asterisks indicate dead organoids that lose the outer epithelial barrier (no blue ring staining), resulting in a diffuse PI staining. Scale bars, 500 µm. Representative images were shown to reveal the protective effect of palbociclib.
e. Quantification of d. Percentage of viable organoids shown as mean ± SEM of five in-plate replicates for each condition. Two-way ANOVA with Dunnett’s multiple comparison test, ***p < 0.001, n.s. not significant.
f. Organoids were treated with 800 nM gemcitabine (red line) or co-treated with 1 µM palbociclib and 800 nM gemcitabine (blue line) as described in a. Images were taken daily with bright field. Mean of three in-plate replicates ± SEM per condition. Organoid area on day 1 was set 100% and organoid growth was normalized to day 1, indicating more pronounced growth when organoids had been treated with palbociclib before exposure to gemcitabine. Student’s t-test. **p < 0.01, n.s. not significant.
g. Representative bright field images from f. Scale bars, 300 µm. The enlarged image sections show a destroyed organoid treated with gemcitabine alone, and an intact organoid that had been exposed to both palbociclib and gemcitabine.