
Fig. 7.
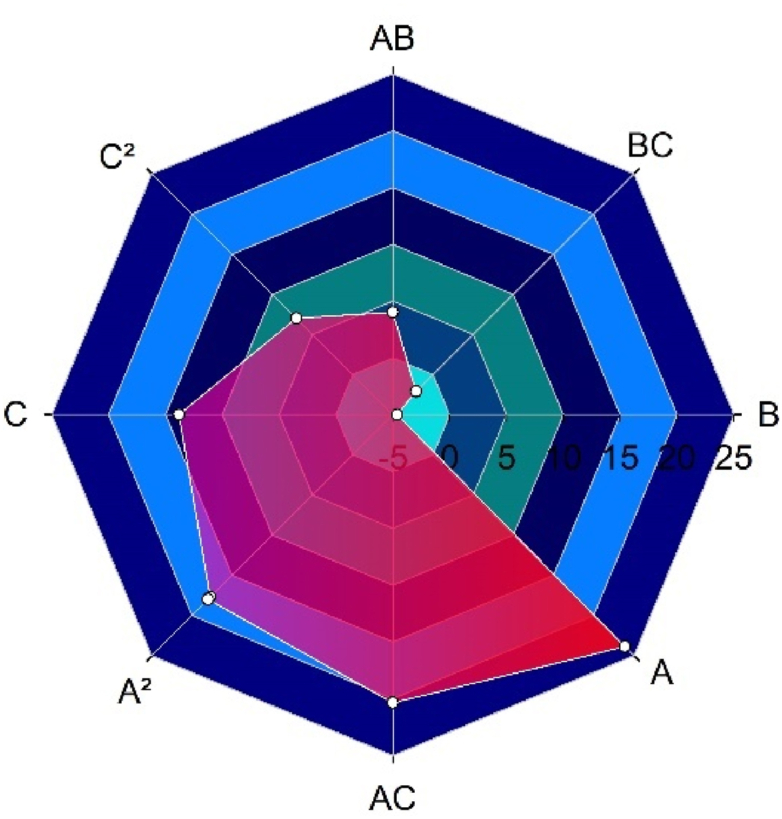
Spider web chart for design parameters and interactions and their effects on average available power inside the duct throat.
Official websites use .gov
A
.gov website belongs to an official
government organization in the United States.
Secure .gov websites use HTTPS
A lock (
) or https:// means you've safely
connected to the .gov website. Share sensitive
information only on official, secure websites.
Spider web chart for design parameters and interactions and their effects on average available power inside the duct throat.