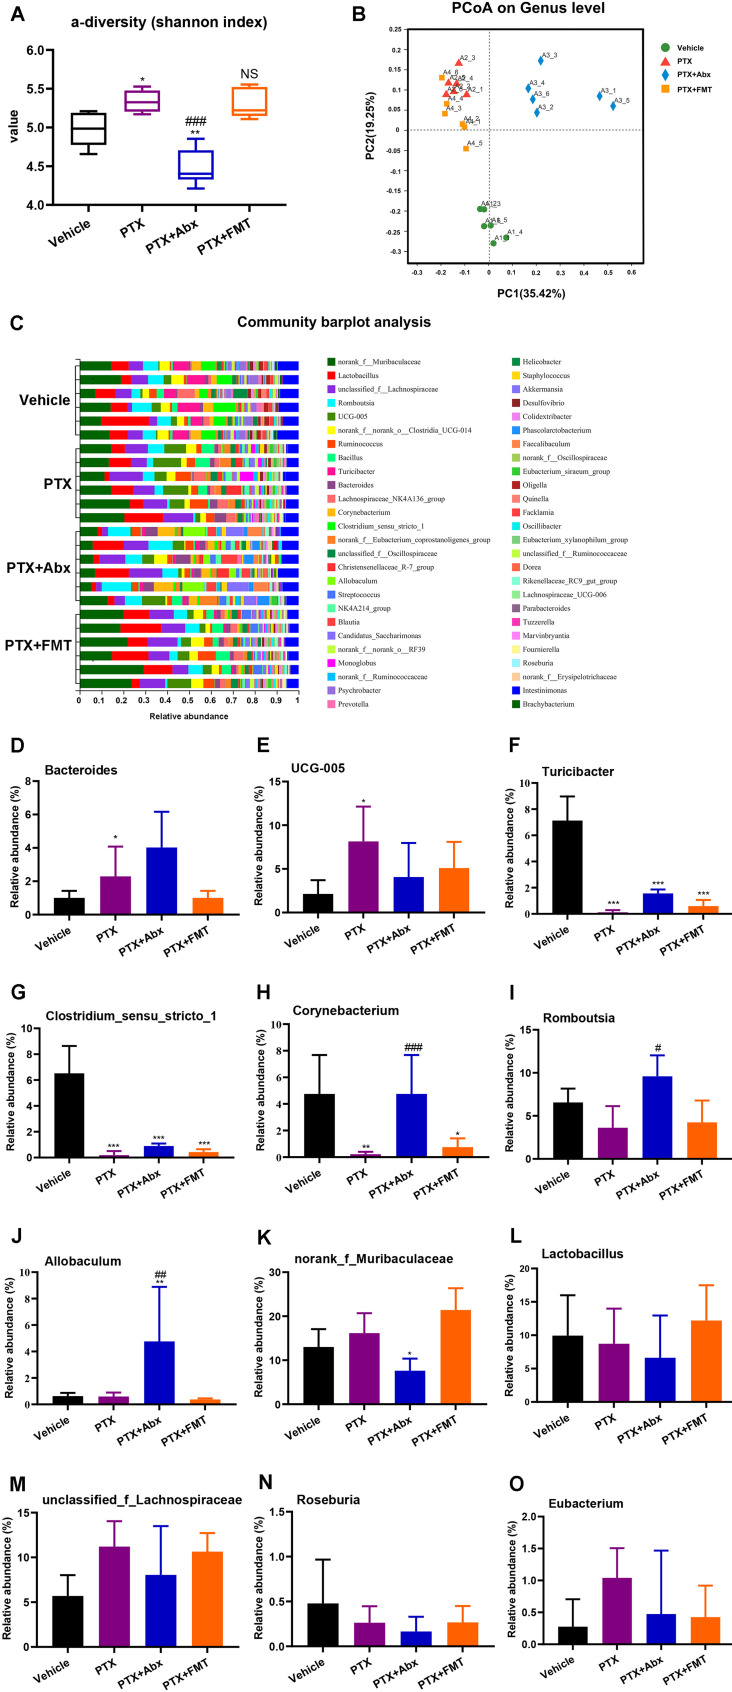
Figure 3.
16S rDNA analysis of gut microbiota composition at the genus level. (A) The α-diversity Shannon index (F3,20 = 24.19, p < 0.0001). (B) Dendrogram of β-diversity using the Principal Coordinated Analysis (PCoA) was used to analyze the gut microbiota in different groups. (C) Based on the quantitative data, the relative abundance of gut microbiota was displayed in a stacked bar plot. (D) Genus Bacteroides (F3,20 = 6.037, p = 0.0042). (E) Genus UCG-005 (F3,20 = 3.554, p = 0.0328). (F) Genus Turicibacter (F3,20 = 67.14, p < 0.0001). (G) Genus Clostridium_sensu_stricto_1 (F3,20 = 47.12, p < 0.0001). (H) Genus Corynebacterium (F3,20 = 8.395, P = 0.0008). (I) Genus Romboutsia (F3,20 = 8.290, p = 0.0009). (J) Genus Allobaculum (F3,20 = 6.257, p = 0.0036). (K) Genus norank_f_Muribaculaceae (F3,20 = 11.66, p = 0.0001). (L) Genus Lactobacillus (F3,20 = 0.9852, p = 0.4197). (M) Genus unclassified_f_Lachnospiraceae (F3,20 = 2.2, p = 0.12). (N) Genus Roseburia (F3,20 = 1.247, P = 0.3191). (O) Genus Eubacterium (F3,20 = 1.648, p = 0.2102). * p < 0.05, ** p < 0.01 and ***p < 0.001 compared with the Vehicle group. #p < 0.05, ##p < 0.01 and ###p < 0.001 compared with the PTX group. NS, not significant compared with the vehicle group. Data are expressed as mean ± standard deviation (SD), with n = 6 rats per group.
Abbreviations: A1, Vehicle group; A2, PTX group; A3, PTX + Abx group; A4, PTX + FMT group; Abx, antibiotics; FMT, fecal microbiota transplantation; PTX, paclitaxel.

