
FIGURE 7.
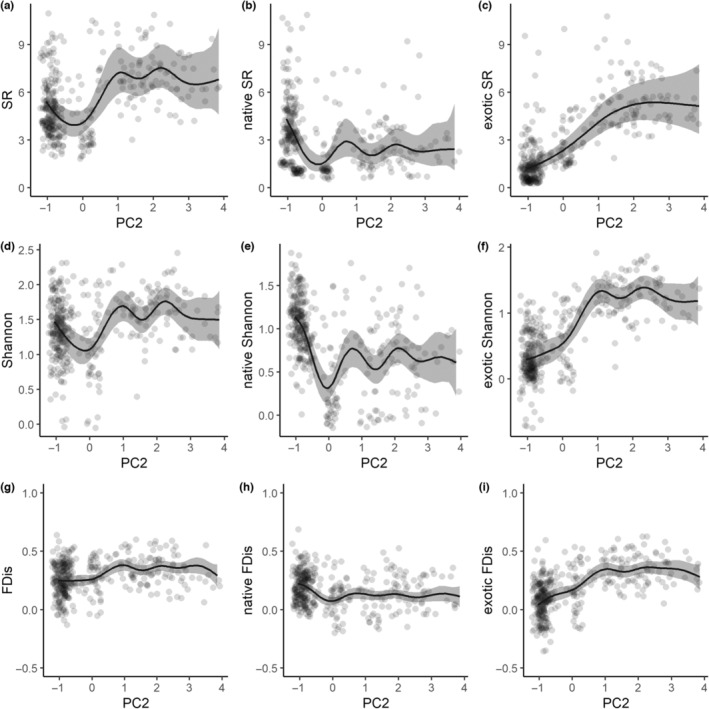
Variation of species richness (SR), Shannon's index (Shannon) and functional dispersion (FDis) along a principal component axis synthesizing habitat heterogeneity within sampling sites (PC2, homogeneous sites in negative values, heteregeneous sites showing mosaics of native and anthropogenic habitats in positive values). From left to right: all species, native species, exotic species.