
FIGURE 3.
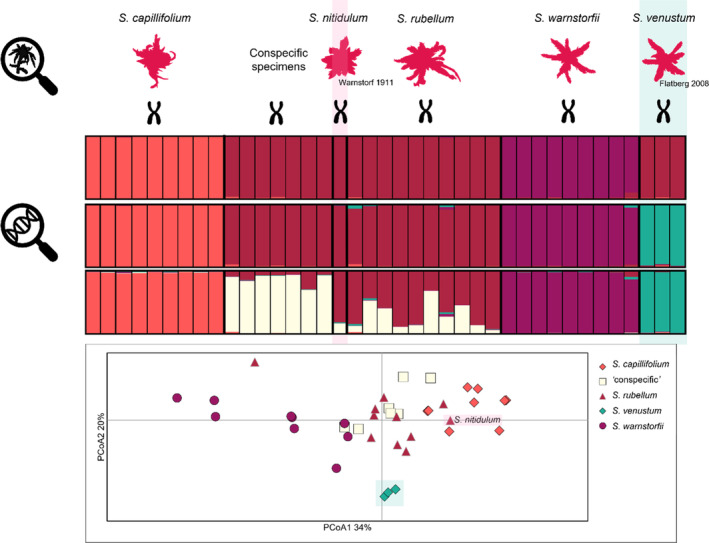
Barplots show the result of STRUCTURE analysis of 15 microsatellite data of five morphologically described Sphagnum sect. Acutifolia species and seven specimens assigned as conspecific. The order of the bars, from left to right, follows the order of individuals listed in Tables 1 and 2. The barplots show the results for different number of genetic clusters: 3 (results of 10/10 runs), 4 (results of 8/10) and 5 (10/10 runs). The PCoA (below) shows that S. venustum is separated from the other species, that are overlapping. The S. nitidulum sample (named and colored pink in the plot) was included as S. rubellum in the analysis and found within specimens of S. rubellum and S. capillifolium.