
Figure 3:
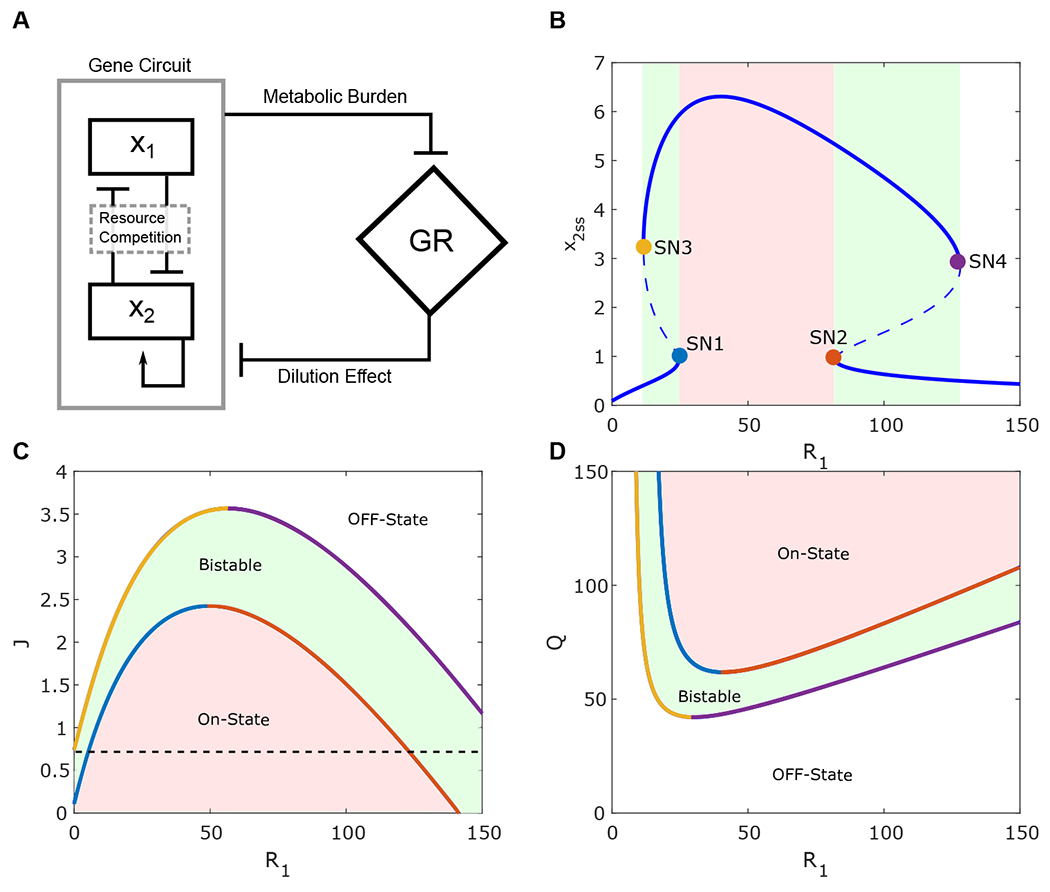
Analysis of the synthetic gene circuit with a gene with an inducible promoter and a self-activation module. (A) Diagram of interaction between a synthetic gene circuit with a gene with an inducible promoter (x1) and self-activation (x2) modules and growth rate. (B) The bifurcation diagram of x2 with respect to R1. Solid and dashed lines correspond to stable and unstable steady state points. Solid circles denote the saddle-node bifurcation points (blue, orange, yellow, and purple for SN1-4, respectively). (C-D) Two-parameter bifurcation diagram shows the dependence of the saddle-nodes (SN1-4) on J (Q in (D)) and R1. SN1 (blue line), SN2 (orange line), SN3 (yellow line), and SN4 (purple line) correspond to the saddle-node bifurcation points. The red region represents the ON-state of x2 Module, the green region corresponds to the system bistability, and the white region represents the OFF-state of the x2 module