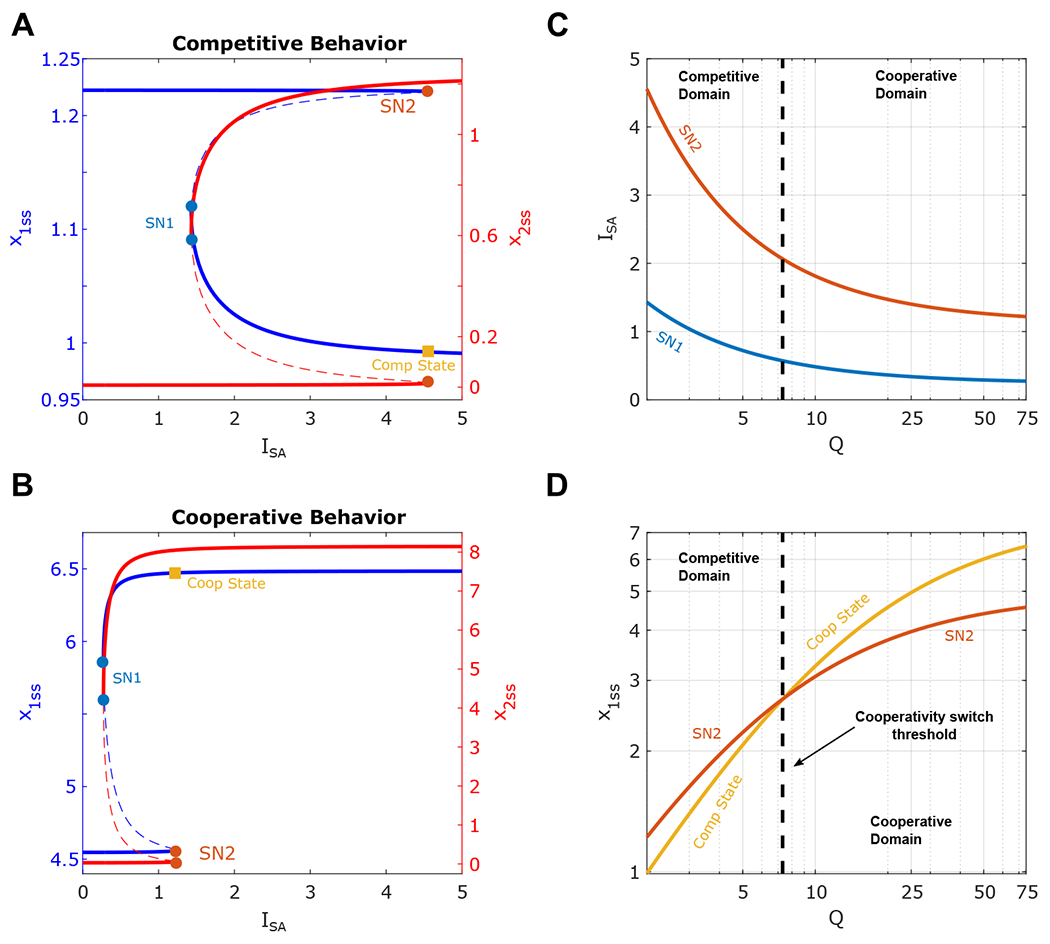
Figure 4:

Analysis of the dynamics of one Constitutively Expressing (CE) Circuit upon induction of One Bistable SA Circuit . (A-B) One-parameter bifurcation diagram of x1 (blue) and x2 (red) with respect to ISA. Solid and dashed lines correspond to stable and unstable steady states, respectively. Solid circles denote the saddle-node bifurcation points ( SN1-2, respectively). Q = 75 in A and Q = 2 in B. (C) Two-parameter bifurcation diagram shows the dependence of the saddle-node bifurcation (SN1-2) on Q value. (D) The expression levels of the CE circuit at the ON/OFF states around the activation threshold of the SA circuit (SN2) . The dashed black line at the intersection of two curves indicates the boundary of the competitive domain (left) and cooperative domain (right).
