
Figure 5:
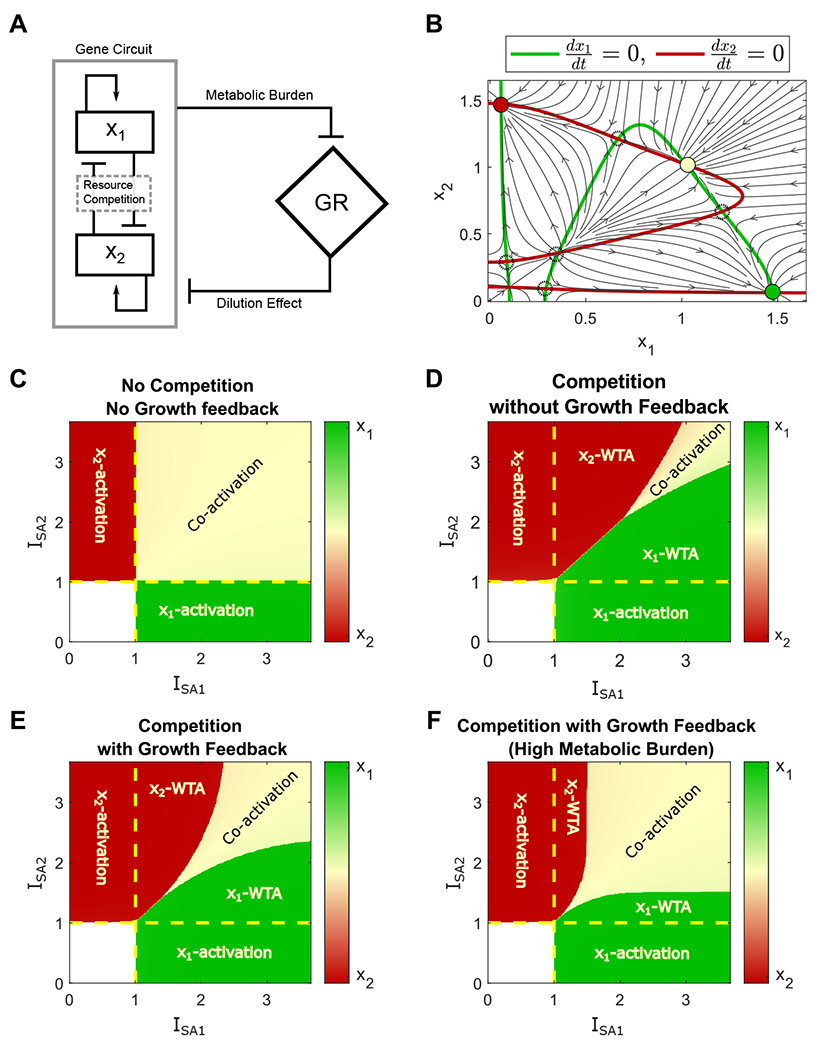
Cooperativity induced by the Growth feedback remediates the winner-take-all (WTA) competition of two self-activation modules. (A) Diagram of interaction between a synthetic gene circuit with two self-activation modules and growth rate. (B) Nullcline analysis. Green and red lines represent the nullcline (dx1/dt = 0, dx2/dt = 0) for x1 and x2, respectively. Solid and dashed circles represent stable and unstable steady states. Black arrows represent the directional field of the system. (C-F) Cell fates in the space of inducer ISA1 and ISA2, starting from the OFF-OFF state, normalized with respect to the switch activation thresholds under conditions with neither competition nor growth feedback (C), with resource competition and no growth feedback (D); competition with metabolic burden (E)(J1 = J2 = 15), and high metabolic burden (F)(J1 = J2 = 4).