
Fig. 1.
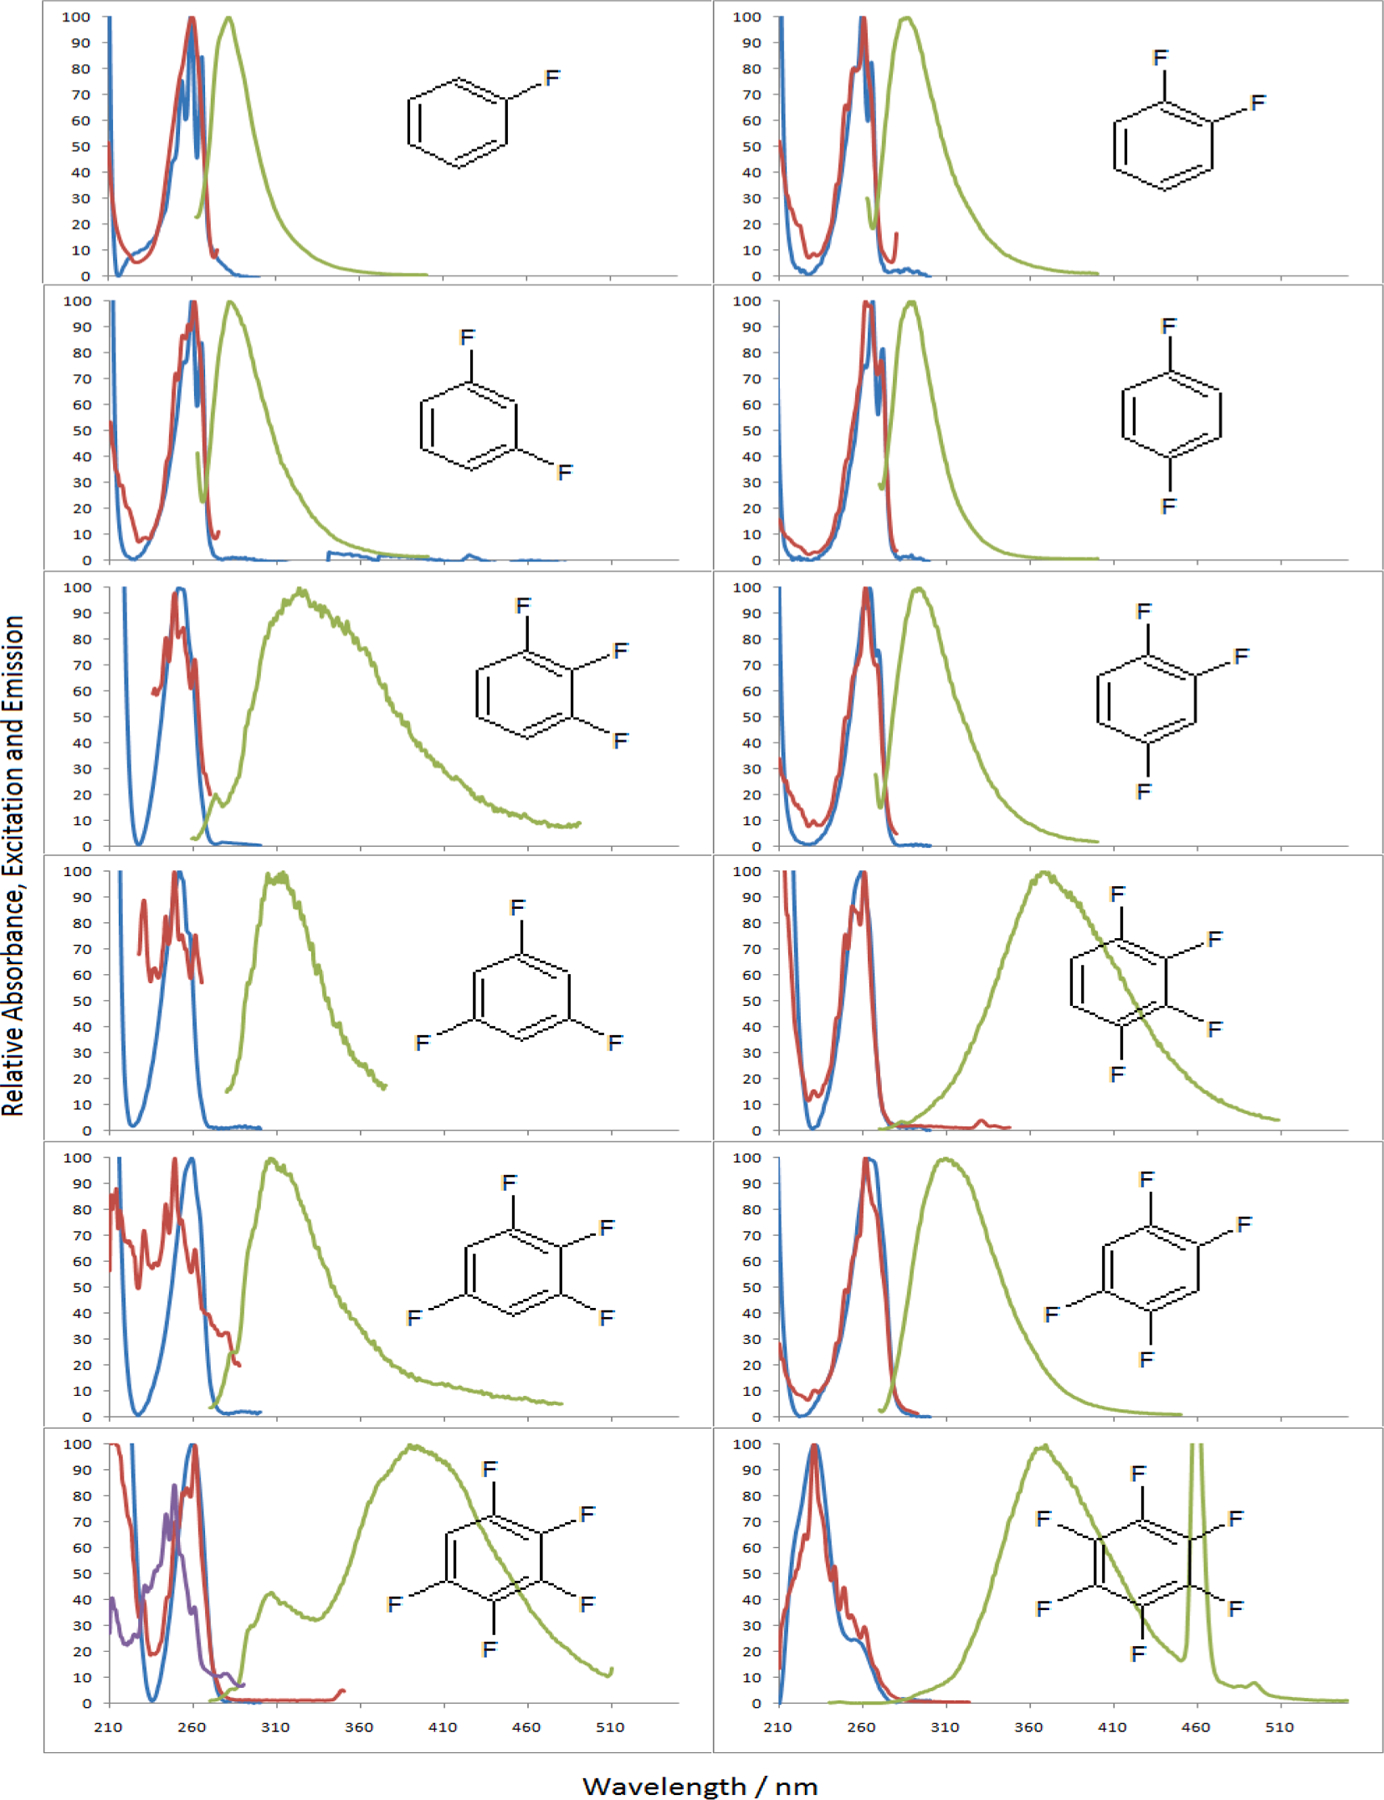
Normalized absorbance (blue) and emission (green) of the 12 fluorinated benzenes in acetonitrile with the corresponding excitation spectrum (red) for their λem max. The excitation spectrum of the 305 nm emission peak of PFB is also shown (purple). (For interpretation of the references to colour in this figure legend, the reader is referred to the web version of this article.)