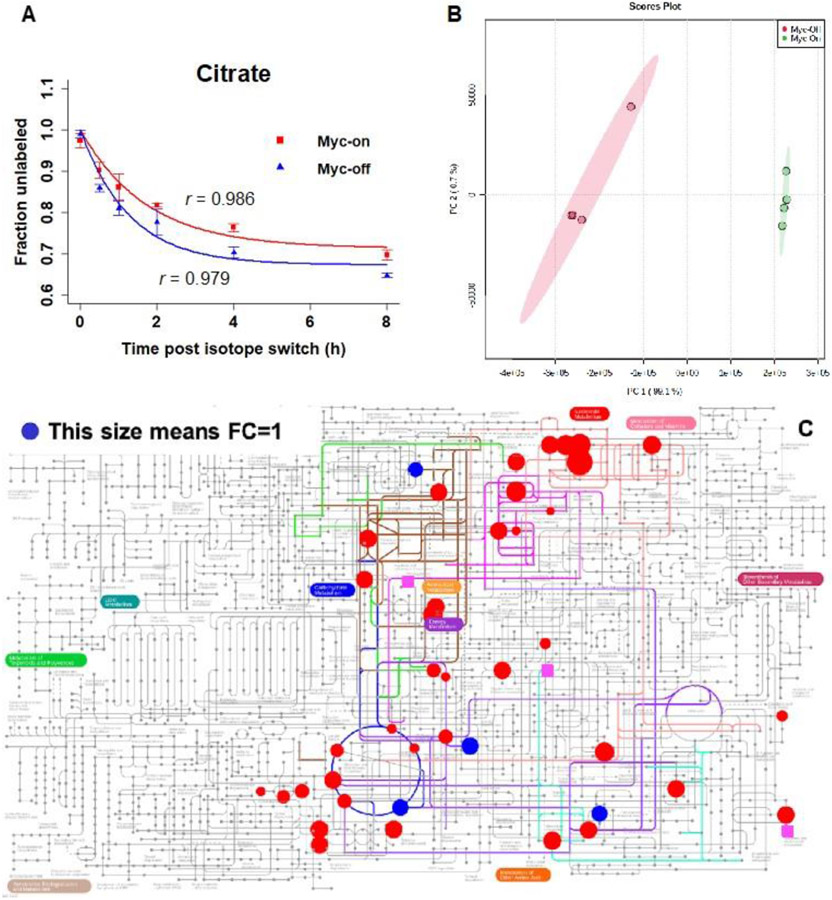
Fig.4.
A) Exponential fitting of the time-course data of citrate, B) the PCA score plot, and C) pathway view of metabolites with relative flux derived, for the comparison of Myc-On and Myc-Off Tet21N cells under pseudosteady state following U-13C6-glucose labeling: red circles have p values < 0.05, blue circles have p values > 0.05, pink squares indicate metabolites present only in the Myc-Off group. This figure is reproduced from [171] with permission.

