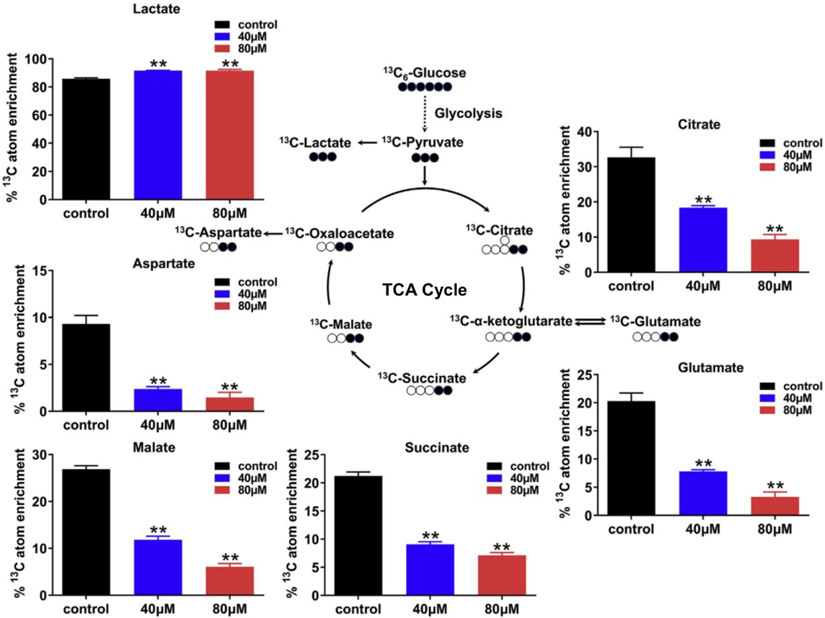
Fig. 5.
Incorporation of glucose-derived carbon atoms into the TCA cycle and glycolysis metabolites. Bar charts left to right: control (black), 40 μM BDE-47 (blue), and 80 μM BDE-47 (red) groups; the Y-axis depicts the mean of isotopic enrichment of 13C in the metabolites. ** indicate a highly significant difference (p < 0.01). This figure is reproduced form Ref. [224] with permission.

