
Fig. 1. Lifetime imaging of action potentials.
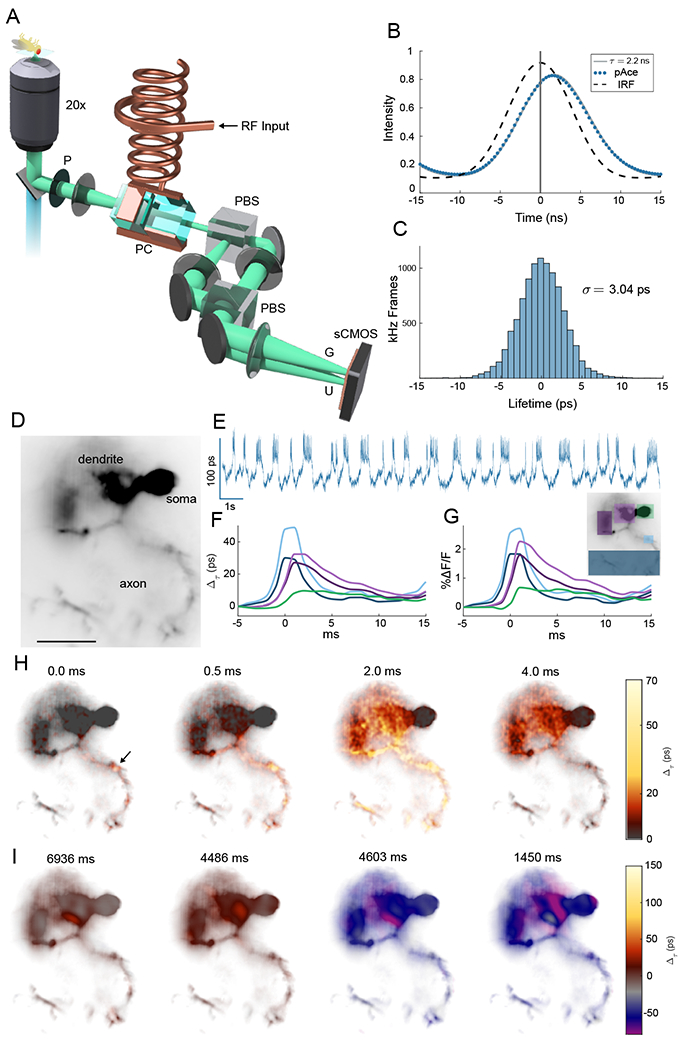
(A) Schematic of EO-FLIM microscope. Wide-field fluorescence images were modulated by a Pockels cell (PC) placed between crossed polarizers (P and PBS) and driven at 20 MHz by a high voltage resonant transformer. Two spatially offset output images were simultaneously captured after a second polarizing beamsplitter (PBS) on a sCMOS camera, corresponding to gated (G) and ungated (U) intensities. (B) Instrument response function (IRF) and fluorescence traces for the U channel were measured by varying the Pockels cell drive phase relative to the excitation laser. The pAce GEVI was fit to 2.2 ns lifetime. For kilohertz imaging, a single optimal phase point was captured (vertical line at 0 ns delay) and the G/U image intensity ratio was converted to a lifetime estimate (see also Fig. S1). (C) Histogram of measurements (highpass filtered) obtained at 1 kHz for a single neuron in vivo demonstrate a lifetime sensitivity of 3 ps (full trace in Fig. 2(A)) (D) Wide-field image of a neuron with structures indicated (scalebar 25 μm) (E) Whole cell lifetime trace resolves action potentials and sub-threshold transitions (F, G) Average spike shape is plotted in intensity and lifetime from color-coded regions (H) Frames from an interpolated lifetime movie demonstrate spike propagation, averaging the signal from ~300 individual spikes. The point of initiation is indicated by the arrow, and bidirectional propagation was observed both along the axon and backwards towards soma and dendrites (see Movies S1–S3). Spike propagation was also imaged directly without averaging in Movies S4 and S5. (I) Applying a 10 frame moving average allowed sub-threshold signals to be localized to neuron structures in Movies S6 and S7. Example frames demonstrate localization in the dendrite for both positive and negative sub-threshold signals.