
Fig. 4. Phase locking of spikes to direct mechanical stimulus.
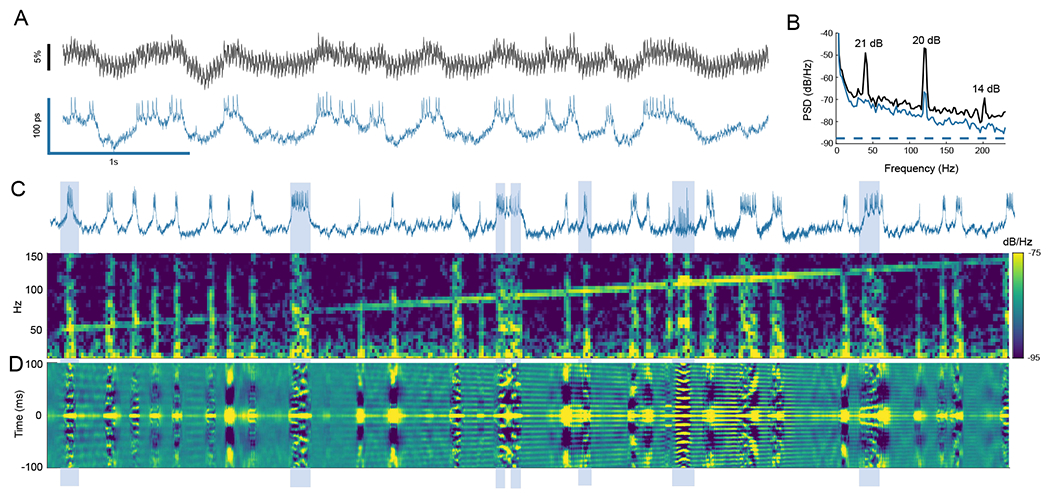
(A) Lifetime provided strong rejection of intensity noise associated with shaking the sample (40 Hz square wave, ~ 0.8 μm peak-to-peak). (B) Intensity noise at the stimulus frequency and second harmonic were attenuated by 21 and 20 dB. (C) A spectrogram of the lifetime trace is plotted as stimulus is swept from 50 to 150 Hz. Vertical lines of activity in the spectrogram correspond to spike bursts in the lifetime trace. Mechanical cross-talk is seen as the diagonal line sweep, and phase locking appears as increased frequency content at the stimulus frequency during spike bursts. (D) To show phase locking visually, a sliding window autocorrelation of the lifetime trace is plotted using a 150 ms window. Phase locking may be seen by observing alignment of autocorrelation peaks during activity bursts to the peaks resulting from mechanical cross-talk signal. Examples of bursts showing phase locking are highlighted.