
Figure 7.
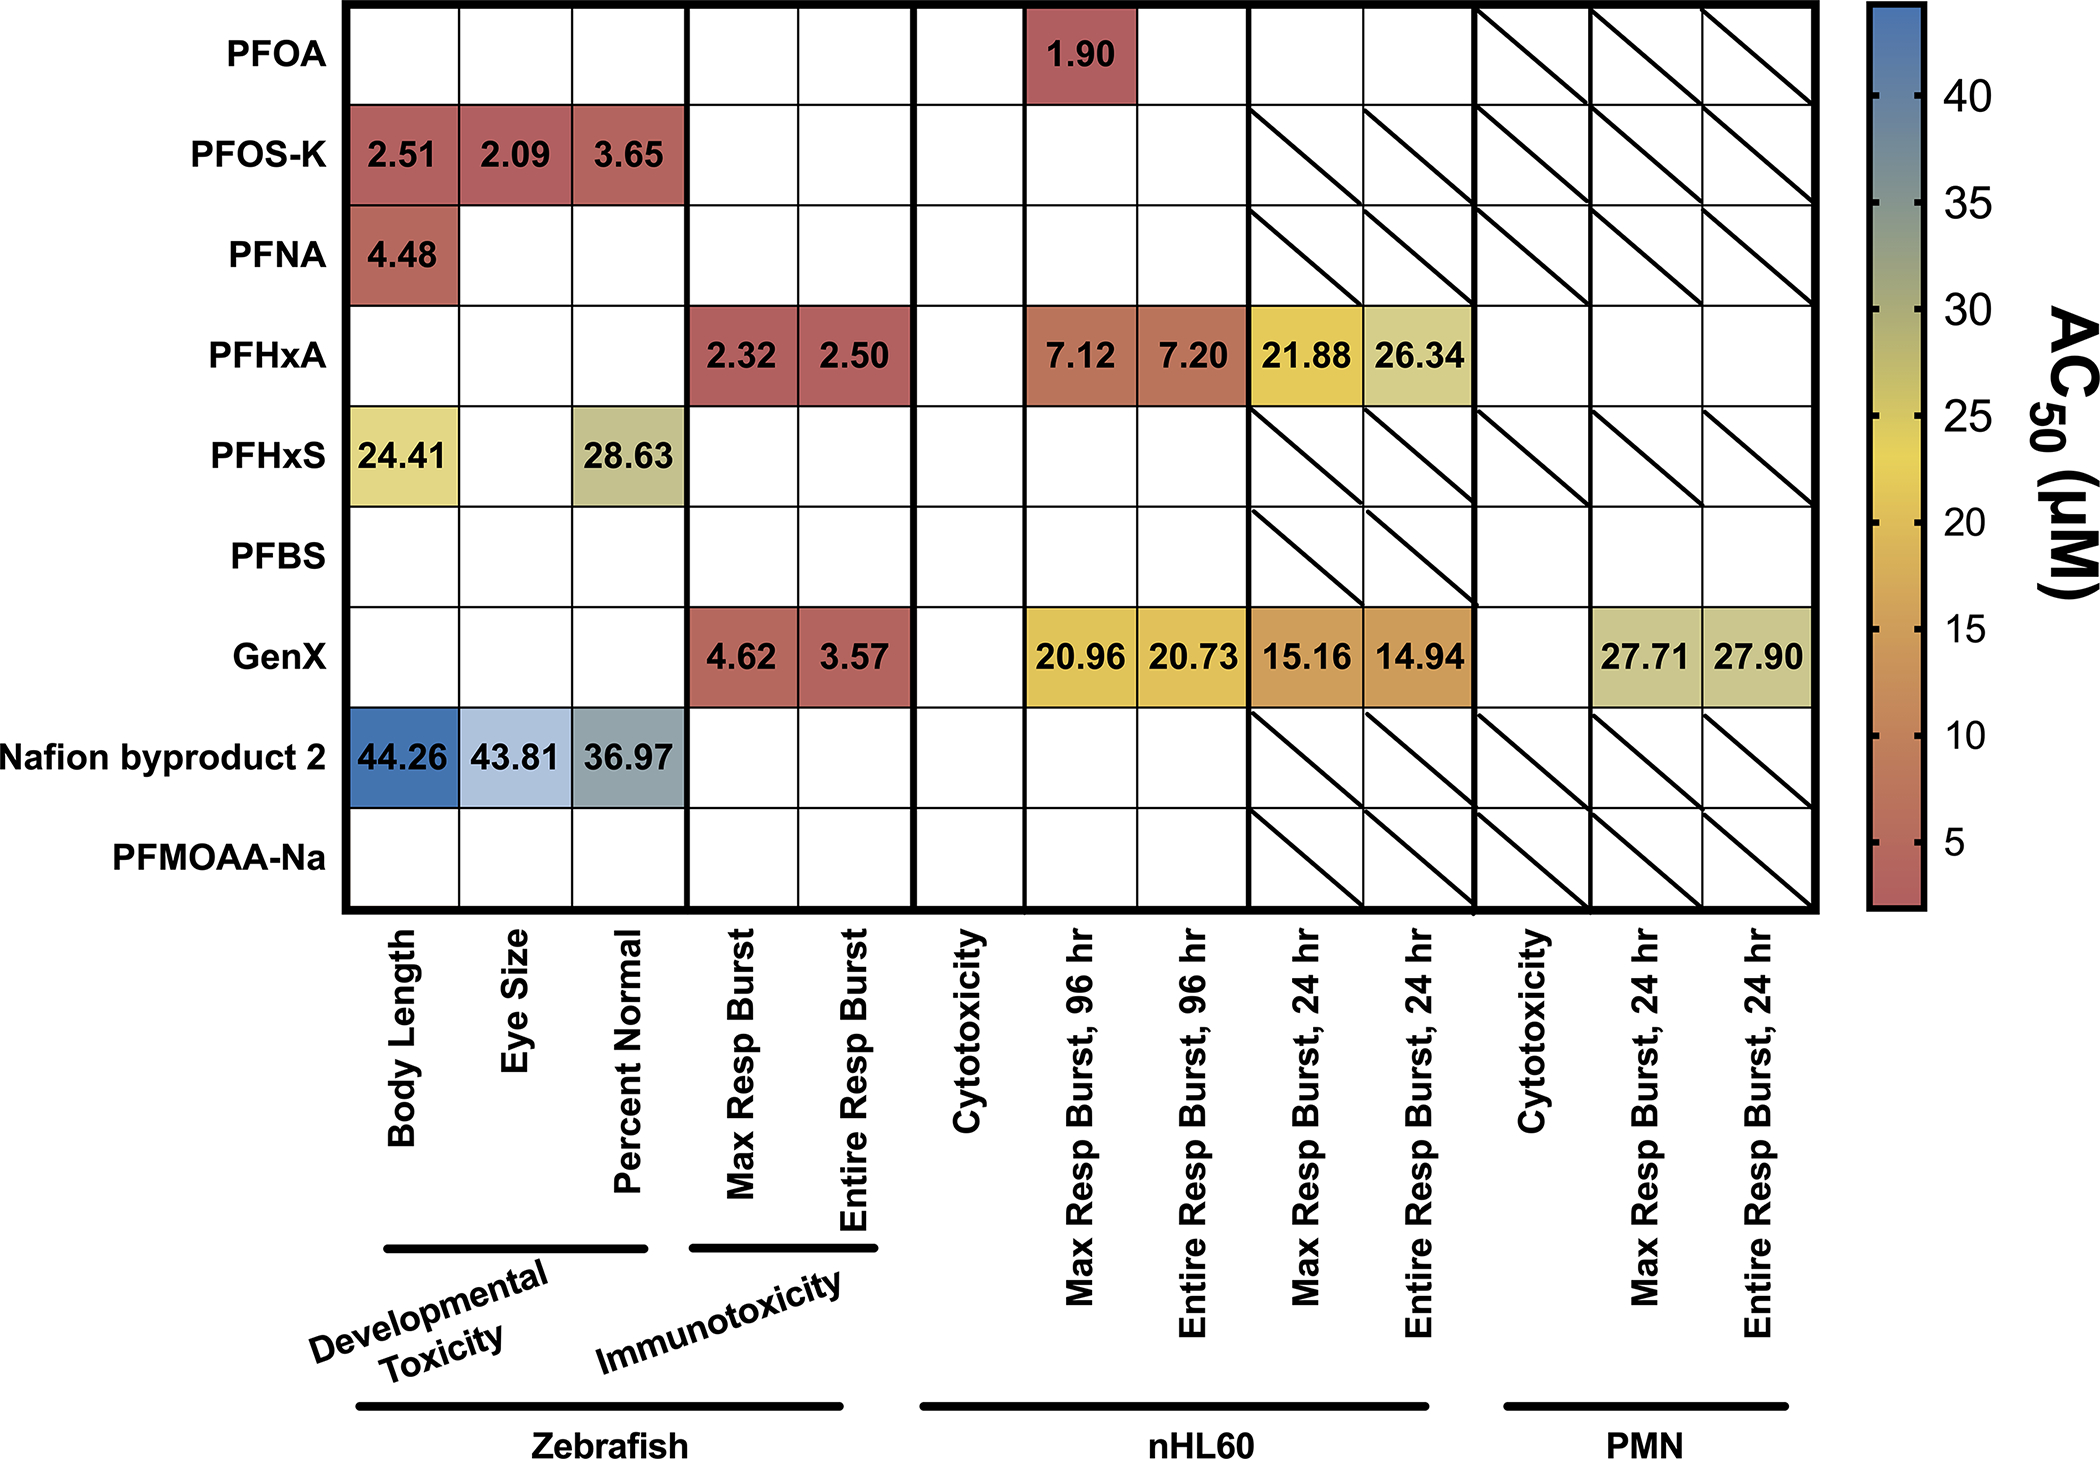
Summary of PFAS impact on zebrafish development, cell viability and respiratory burst in vivo, in vitro and ex vivo. AC50 values of each assay are displayed on a heatmap. Empty squares indicate no statistically significant effect at any dose. Squares with a slash indicate that the test compound was not tested in that assay. AC50 values were calculated as described in the Methods. Concentration response graphs for individual test compounds can be found in the Supplemental Figures.