
Figure 7.
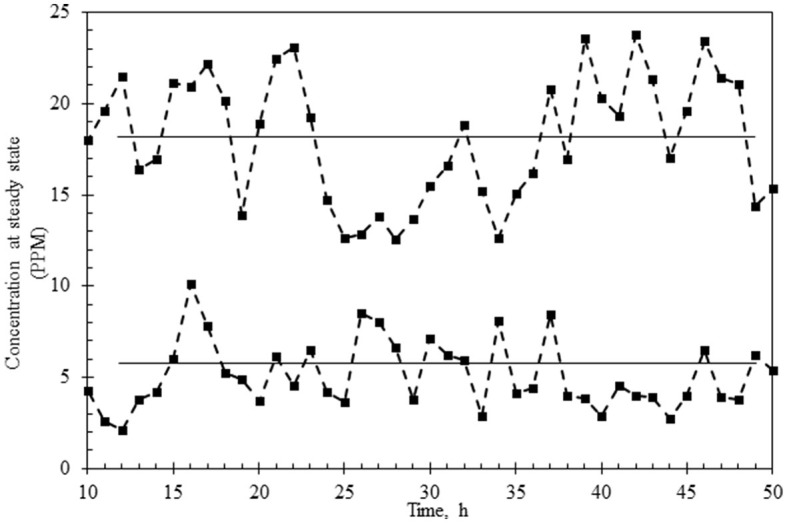
Variance of the dye concentration under a pseudo-steady-state of reactor operation at HRT of 3 h (upper graph) or 6 h (lower graph). The mean concentration of the dye is shown as a straight line in the data points.
Official websites use .gov
A
.gov website belongs to an official
government organization in the United States.
Secure .gov websites use HTTPS
A lock (
) or https:// means you've safely
connected to the .gov website. Share sensitive
information only on official, secure websites.
Variance of the dye concentration under a pseudo-steady-state of reactor operation at HRT of 3 h (upper graph) or 6 h (lower graph). The mean concentration of the dye is shown as a straight line in the data points.