FIGURE 1.
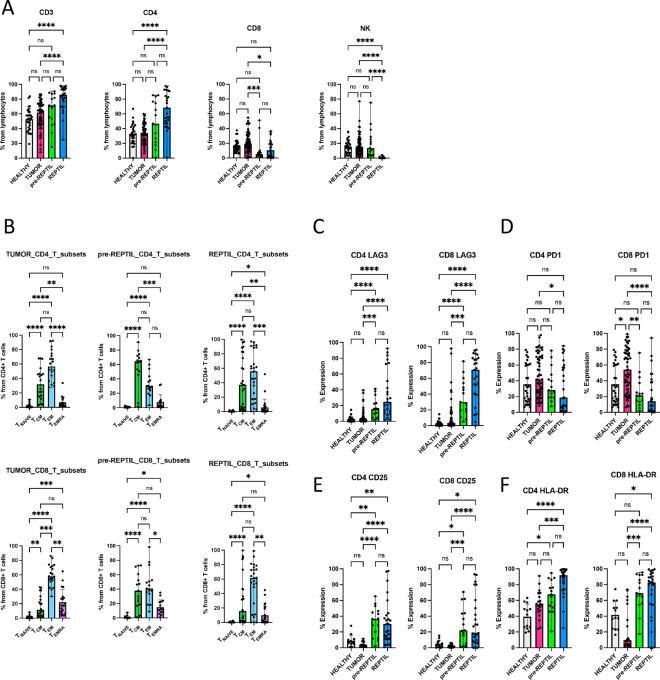
Immunophenotypic differences between tumor, healthy kidney tissue, pre-REP TILs, and REP TILs. A, Matching healthy kidney tissue (n = 30), tumor (n = 58), pre-REP TIL (n = 15), and REP TIL (n = 25) samples were used for flow cytometry immunophenotypic analysis. The median positive expression levels were compared between each sample type. The pre-REP TILs and REP TILs had a greater abundance of CD4+ T cells (median 46.8% and 68.4% out of lymphocytes, respectively) than CD8+ T cells (4.8% and 10.5%), compared with the tumor CD4+ (34%) and CD8+ (19.5%) T cells. In contrast, an increased proportion of cells in the tumor (14.4%), healthy kidney (14.4%), and pre-REP TIL (13.5%) samples were NK cells. B, The CD4+ and CD8+ T cell immunophenotypes were analyzed using CCR7 and CD45RO markers. Most of the pre-REP TIL CD4+ T cells were of the central memory (TCM; CCR7+ CD45RO+) phenotype (median 64%), and the pre-REP TIL CD8+ T cells were either TCM (37.7%) or effector memory (TEM; CCR7-CD45RO+, median 40.8%) cells. REP TIL CD4+ T cells were TCM (37%), but more TEM (55.8%) cells, whereas more than half (61.5%) of the REP TIL CD8+ T cells were TEM cells. TNAIVE = naïve T cells, TCM = central memory T cells, TEM = effector memory T cells, TEMRA = terminally differentiated effector memory T cells. C, The greatest LAG-3 expression was observed in the REP TIL CD8+ T cells (median 70.7%) compared with healthy kidney (1.6%), tumor (3.5%), and pre-REP TIL (30%) samples. D, PD-1 expression was greatest in the tumor CD4+ (41.6%) and CD8+ (54%) T cells, suggesting an exhausted phenotype compared with the healthy tissue, pre-REP TILs and REP TILs. E, CD25 expression was highest in both pre-REP TIL (36.5%) and REP TIL (30.1%) CD4+ T cells compared with the tumor and healthy kidney. F, The highest HLA-DR expression was observed in the pre-REP TILs and REP TILs in both CD4+ (67.6% and 91.9%, respectively) and CD8+ T cell compartments (69.3% and 82.8%). For all immunophenotypic analyses, Kruskal–Wallis nonparametric test with Dunn’s post hoc test was used for all analyses. ns, not significant; *, P < 0.05; **, P < 0.01; ***, P < 0.001; ****, P < 0.0001.

