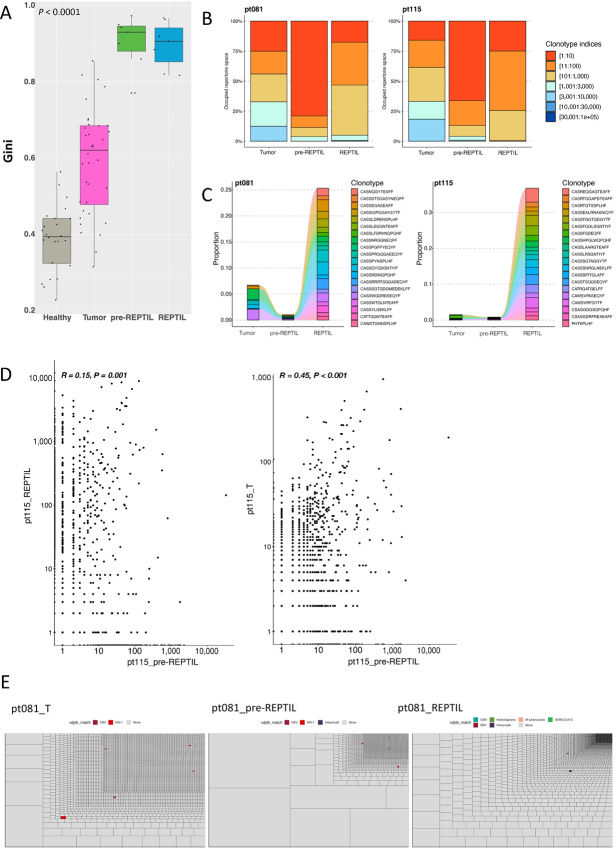
FIGURE 3.
T cell repertoire differences between the tumor and TIL T cells. A, Healthy kidney (n = 24), tumor (n = 36), pre-REP TIL (n = 7), and REP TIL (n = 7) samples were sequenced with bulk TCRβ-seq. The clonality of the TCR repertoire was analyzed with the Gini index (values closer to 1 denote increased clonality). The pre-REP TILs were observed to be the most clonal out of the different samples, suggesting the loss of TCR repertoire diversity during the REP protocol. P < 0.0001, Kruskal–Wallis nonparametric test. B, Two representative cases (pt081 and pt115) showing the relative abundance of clonotypes in the tumor, pre-REP TILs, and REP TILs. The pre-REP TILs were dominated by the top 10 clones of the entire repertoire. Clonotype indices represent the rank of the clone (i.e., 1:10 indicates the top 10 most expanded clonotypes). Comparisons between the rest of the samples are found in Supplementary Fig. S4A. C, The top 20 most abundant REP TIL clonotypes were tracked to the corresponding tumor and pre-REP TIL samples in the same representative cases (pt081 and pt115). Overall, the clonotypes ending up in the REP TILs were very small clonotypes in the other sample types. Comparisons between the rest of the samples are found in Supplementary Fig. S4B. D, The frequencies of the overlapping T cell clonotypes in one representative case (pt115) between the REP TIL and pre-REP TIL samples (left), as well as between the tumor and pre-REP TILs (right). Spearman correlation was used to compare the frequencies of the clonotypes in the samples. The x- and y-axes are logarithmically transformed. R and P values refer to the log-transformed frequencies of the clonotypes. The frequencies for the rest of the samples are found in Supplementary Fig. S5 and S6). E, Treemaps showing the size of the T cell clonotypes in each sample type (tumor, pre-REP TIL, and REP TIL) in one representative case (pt081). The size of each box indicates the size of one clonotype in the TCR repertoire. Colored boxes indicate TCRs matched to viral-specific TCRs found in VDJdb (45). Few matches were discovered and represented as small T cell clonotypes, indicating that expanded clones in the tumor, pre-REP TILs and REP TILs do not target common viruses. Treemaps for all the samples are found in Supplementary Fig. S7.

