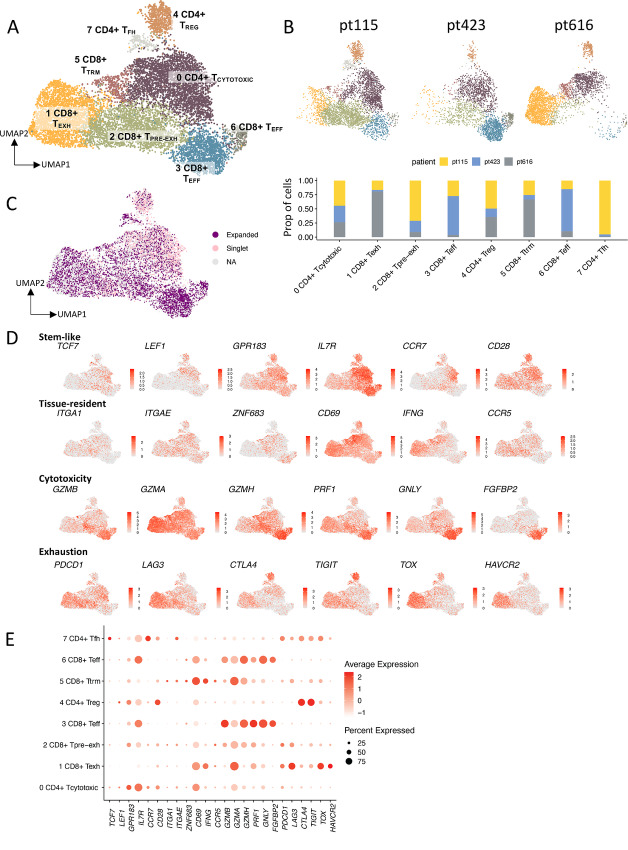
FIGURE 5.
Distinct origins of pre-REP TIL and REP TIL TCR clonotypes in RCC tumors. A, Dissociated tumor samples that were enriched for lymphocytes and flow-sorted for CD45+ cells (n = 3) were analyzed with sc-RNAseq+TCRαβ-seq. The UMAP shows separately clustered T cells, and the UMAP including all cell types can be found in the Supplementary Fig. S9A. Eight different T cell clusters present in the tumor were annotated on the basis of the canonical marker genes, DEGs, and different gene module scores [from Tirosh and colleagues (41)], where each color indicates a distinct T cell cluster. Cluster 0: cytotoxic CD4+ T (TCYTOTOXIC), cluster 1: exhausted CD8+ T cell (TEXH), cluster 2: pre-exhausted CD8+ T (TPRE-EXH), cluster 3: CD8+ T effector (TEFF), cluster 4: CD4+ TREG, cluster 5: CD8+ tissue resident memory (TTRM), cluster 6: CD8+ TEFF), cluster 7: CD4+ T follicular helper (TFH). B, UMAP showing all clusters present in each patient sample (pt115, pt423, and pt616), with distinct T cell phenotypes. The CD8+ TPRE-EXH and CD4+ TFH phenotypes were dominant in pt115, pt423 encompassed a more CD8+ TEFF and CD4+ TCYTOTOXIC phenotype, and pt616 was characterized by CD8+ TEXH and CD8+ TTRM phenotypes. C, Mapped expanded and singlet TCRαβ clonotypes on the tumor UMAP show that the clonotypes lie on distinct parts of the UMAP. Most of the non-expanded (singlet) clonotypes have a CD4+ TCYTOTOXIC phenotype (cluster 0), whereas expanded clonotypes are dominant in the CD8+ TEFF, TPRE-EXH and TEXH phenotypes (cluster 3, 2, and 1, respectively). The relative proportion of the different clonotypes in each of the UMAP clusters is found in Supplementary Fig. S9B. D, Scaled expression of selected canonical markers related to stemness, tissue residency, cytotoxicity, and exhaustion in the T cell UMAP representation as in A. E, Dot plot showing the scaled average (scale) and percentage (dot size) of expression between the selected DEGs for each UMAP cluster. The full list of the top 10 DEGs and their scaled expressions are found in Supplementary Fig. S9C and S9D).

