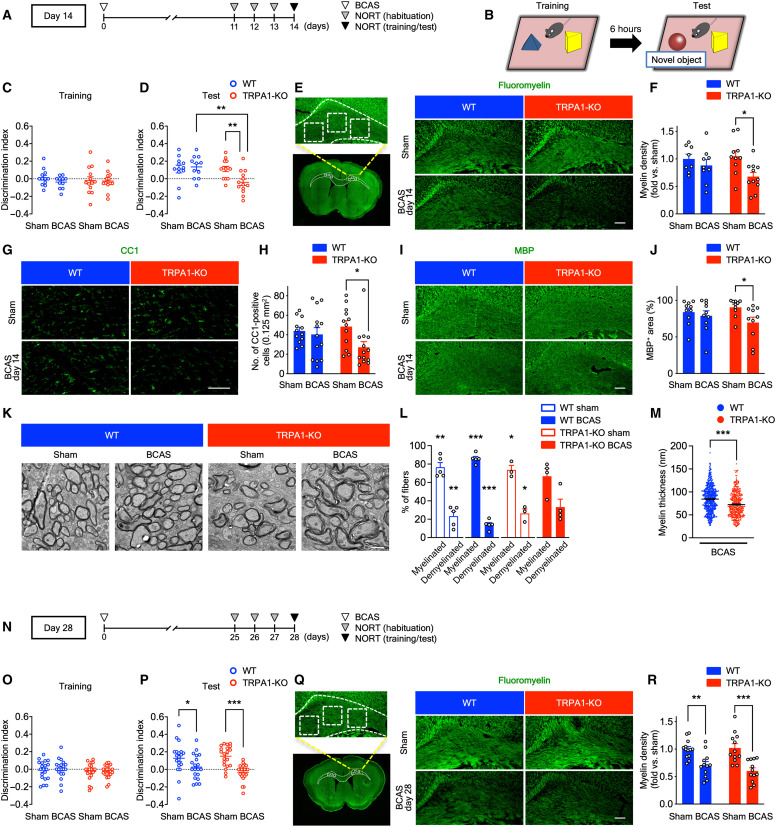
Fig. 1. BCAS induces cognitive impairment and white matter injury on day 14 in TRPA1-KO but not WT mice.
(A, B, and N) The experimental time course on days 14 (A) and 28 (N) and a schematic (B) for the NORT. (C, D, O, and P) Discrimination indexes for exploring the blue quadrangular object during the training session (C) and (O) and the wooden ball, i.e., the “novel object,” during the test session (D) and (P) on days 14 (C) and (D) and 28 (O) and (P). (E to M, Q, and R) Representative images of myelin staining (E) and (Q), immunostaining with anti-CC1 (G) or MBP (I) antibody, and TEM (K) in the corpus callosum as well as summarized data for relative myelin density (F) and (R), the number of CC1-positive cells (H), the percentage of MBP-positive surface areas (J) and myelinated and demyelinated fibers (L), and myelin thickness (M) on days 14 (E) to (M) and 28 (Q) and (R). The dashed line–surrounded area is the corpus callosum and the square-surrounded areas are quantified regions in myelin staining (E) and (Q). Values are means ± SEM. Scale bars, 1 μm (K) and 100 μm (E), (G), (I), and (Q). (C) and (D) n = 11 to 13; (F) n = 8 to 11; (H) n = 12 to 13; (J) n = 10; (L) n = 3 to 5; (M) n = 4 to 5 mice; (O) and (P) n = 20 to 22; (R) n = 12 to 13. *P < 0.05, **P < 0.01, and ***P < 0.001 for two-way analysis of variance (ANOVA) with Bonferroni’s post hoc test (D), (F), (H), (J), (P), and (R). *P < 0.05, **P < 0.01, and ***P < 0.001 for one sample t test (L). ***P < 0.001 for two-tailed unpaired Student’s t test (M).

