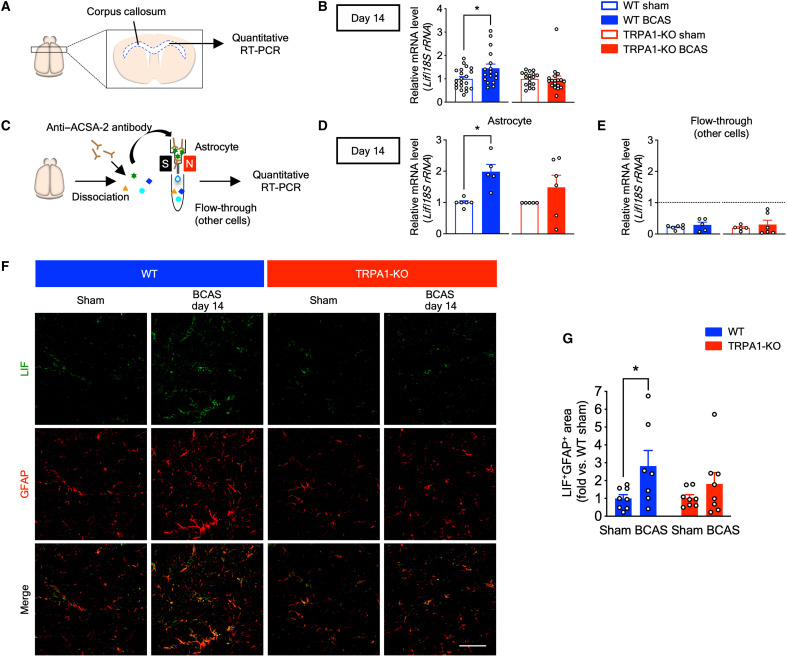
Fig. 6. TRPA1 mediates LIF production in astrocytes in BCAS-operated WT mice on day 14.
(A) A schematic of quantitative RT-PCR of the corpus callosum. (B) Lif mRNA expression in the corpus callosum. (C) A schematic of astrocyte isolation from the whole brain using MACS. (D and E) Lif mRNA expression in isolated astrocytes (D) and flow-through (E). (F and G) Representative images of immunostaining with anti-LIF antibody (green) and anti-GFAP antibody (red) in the corpus callosum (F), as well as summarized data for the percentage of LIF/GFAP double-positive surface areas (G) on day 14. Values are means ± SEM. Scale bar, 50 μm. (B) n = 17 to 21 (WT), n = 18 (TRPA1-KO); (D) and (E) n = 5 to 6 (WT), n = 5 to 6 (TRPA1-KO); (G) n = 7 to 8. *P < 0.05 for two-tailed unpaired Welch’s t test (B) and (D). *P < 0.05 for two-way ANOVA with Bonferroni’s post hoc test (G).

