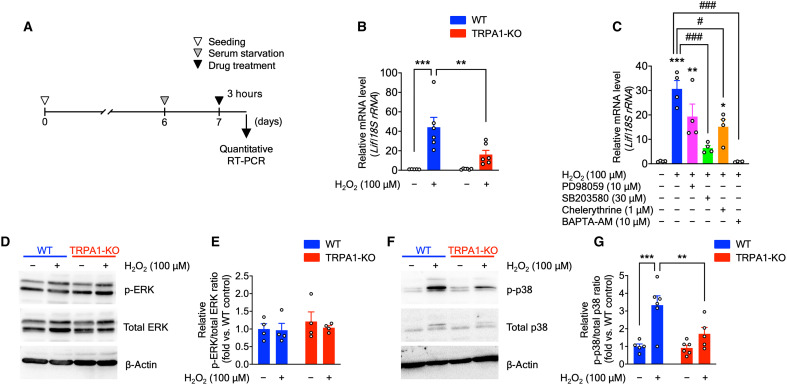
Fig. 8. TRPA1 stimulation by H2O2 induces LIF production via p38-MAPK phosphorylation.
(A) Experimental time course for in vitro experiments using primary astrocyte cultures. (B) Lif mRNA expression in primary astrocyte cultures treated with H2O2 (100 μM, 3 hours), determined by quantitative RT-PCR. (C) Lif mRNA expression in primary astrocyte cultures cotreated with H2O2 (100 μM) and ERK pathway inhibitor (PD98059; 10 μM), p38 inhibitor (SB203580; 30 μM), PKC inhibitor (chelerythrine; 1 μM), and Ca2+ signaling blocker (BAPTA-AM; 10 μM) for 3 hours, determined by quantitative RT-PCR. *P < 0.05, **P < 0.01, and ***P < 0.001 versus control; #P < 0.05 and ###P < 0.001 versus H2O2 for one-way ANOVA with Tukey’s post hoc test. (D to G) Representative immunoblot images of ERK (D) and p38 (F), as well as protein and phosphorylation levels of ERK (E) and p38 (G). Values are means ± SEM. (B) n = 5 to 6; (C) and (E) n = 4; (G) n = 5 to 6. **P < 0.01 and ***P < 0.001 for two-way ANOVA with Bonferroni’s post hoc test (B) and (G).

