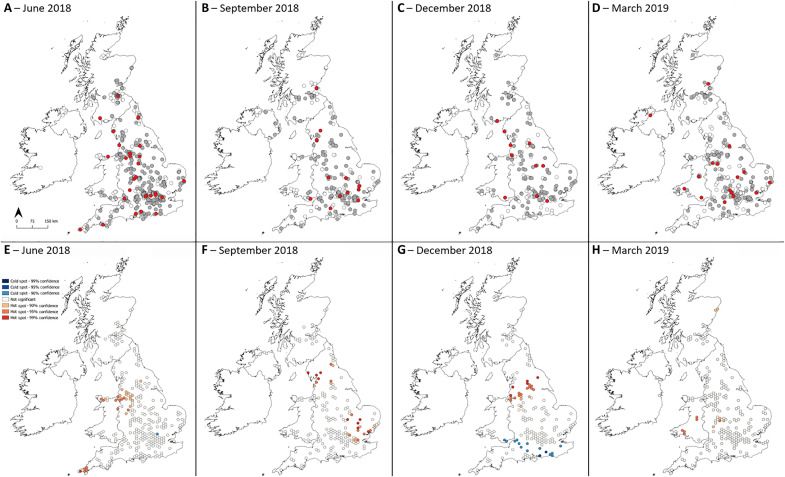
Fig. 2. Maps and clusters showing locations across the UK where air samples were collected during four sampling rounds.
Samples were collected on (A) 21 June equinox 2018, (B) 24 September solstice 2018, (C) 21 December equinox 2018, and (D) 20 March solstice 2019. White dots indicate samples that did not grow A. fumigatus, gray dots indicate samples that grew tebuconazole-susceptible A. fumigatus, and red dots indicate samples that grew tebuconazole-resistant A. fumigatus. Hotspots of azole-resistant A. fumigatus with 90, 95, and 99% confidence according to Getis-Ord Gi* cluster detection analysis for sampling rounds on (E) 21 June 2018, (F) 24 September 2018, (G) 21 December 2018, and (H) 20 March 2019.

