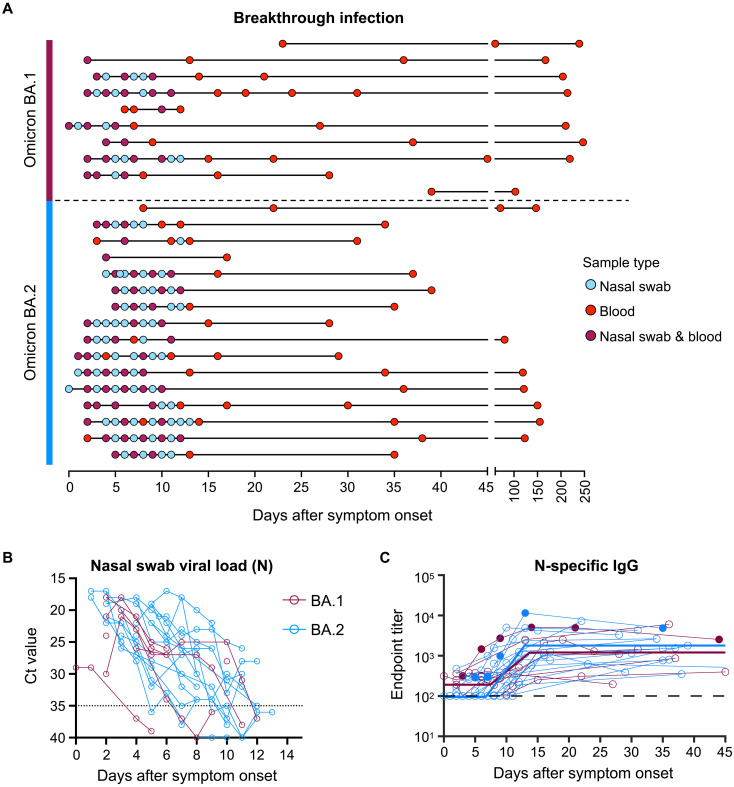
Fig. 1. Viral load kinetics and seroconversion to N following Omicron BA.1 and BA.2 breakthrough infection.
(A) Schematic of longitudinal sample collection following breakthrough infection of vaccinated individuals with Omicron BA.1 (n = 10) or BA.2 (n = 16). Each line represents a single subject, and each point represents a sample collection (blue, nasal swab; red, blood; purple, both nasal swab and blood). (B) Kinetics of SARS-CoV-2 viral load in nasal swabs measured by quantitative polymerase chain reaction (qPCR) of the nucleocapsid (N) gene. (C) Kinetics of plasma IgG titers against SARS-CoV-2 N following breakthrough infection with BA.1 (red) or BA.2 (blue). Subjects with previous SARS-CoV-2 infection are depicted in closed circles. The thick lines represent the mean estimate from the piecewise linear regression model using the estimated parameters.

