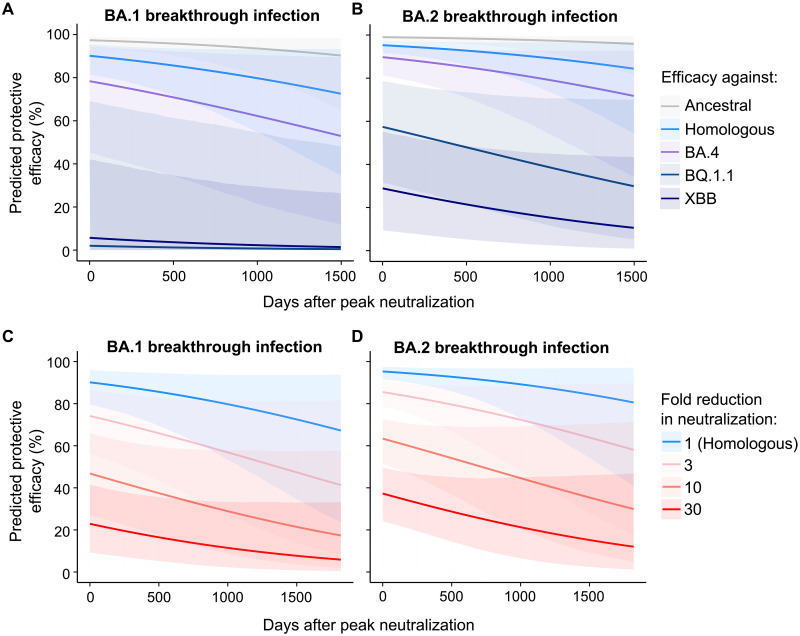
Fig. 4. Modeling the protective efficacy against symptomatic SARS-CoV-2 reinfection following BA.1 and BA.2 breakthrough infection.
(A and B) The predicted decay in efficacy against symptomatic reinfection after peak neutralization (about day 30 after symptom onset) based on the peak neutralization titers observed against ancestral virus, the homologous infecting Omicron variants and Omicron strains that individuals had not yet encountered (BA.4, XBB, and BQ.1.1) using the aggregate decay rate estimated. (C and D) The predicted decay in efficacy after peak neutralization titers given a theoretical loss of neutralization (i.e., 1-, 3-, 10-, or 30-fold loss of neutralization) to a new variant compared to the homologous neutralization titers after breakthrough infection [i.e., blue lines in (A) and (B)]. Lines are predicted efficacies and shaded regions indicate 95% confidence intervals of predicted efficacies.

