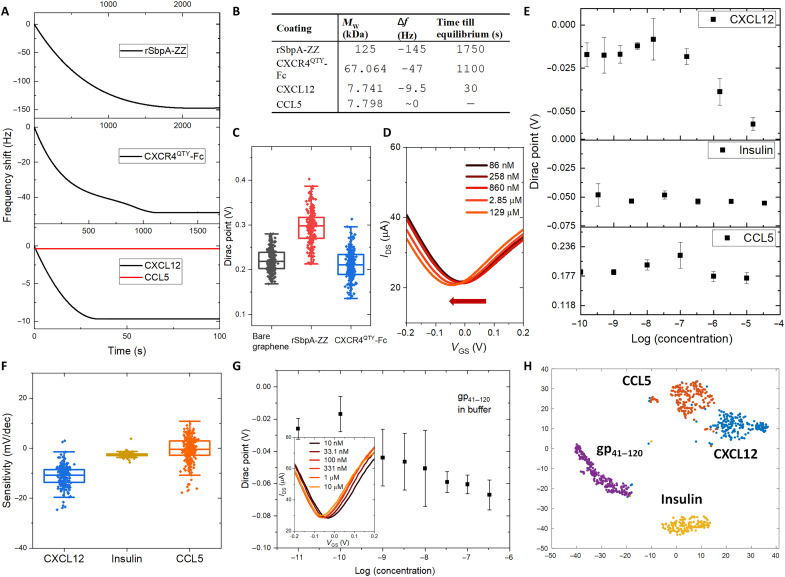
Fig. 3. Ligand detection in buffer.
(A) Frequency shift profile in each step of protein coatings and ligand detections as a function of time. (B) Table summarizes the frequency shift (Δf), time till equilibrium, and molecular weight (MW) of bound proteins for sequential coatings of rSbpA-ZZ, CXCR4QTY-Fc, and detections of CXCL12 and CCL5 in the nanomolar concentration. (C) Average Dirac points (DPs) of graphene-based field-effect transistor (GFET) arrays for bare graphene, rSbpA-ZZ coating, and CXCR4QTY-Fc coating. (D) The left shift in averaged drain current with respect to gate-to-source voltage(IDS-VGS) curves from the fully constructed array with respect to a gradient concentration of CXCL12. (E) The averaged DP shifts from the fully constructed array with respect to a gradient concentration of CXCL12, CCL5, and insulin. Error bar indicates the standard deviation of three repeat measurements. (F) Distribution of sensor sensitivities toward the native ligand and the negative controls. (G) The plot of averaged concentration-dependent response and IDS-VGS curve (insert) from the fully constructed device array toward recombinant HIV coat glycoprotein gp41–120. Error bar indicates the standard deviation of three repeat measurements. (H) Well-defined nonoverlapping clusters via t-distributed stochastic neighbor embedding (t-SNE) dimension reduction processing of data from experimental sets in buffer.

