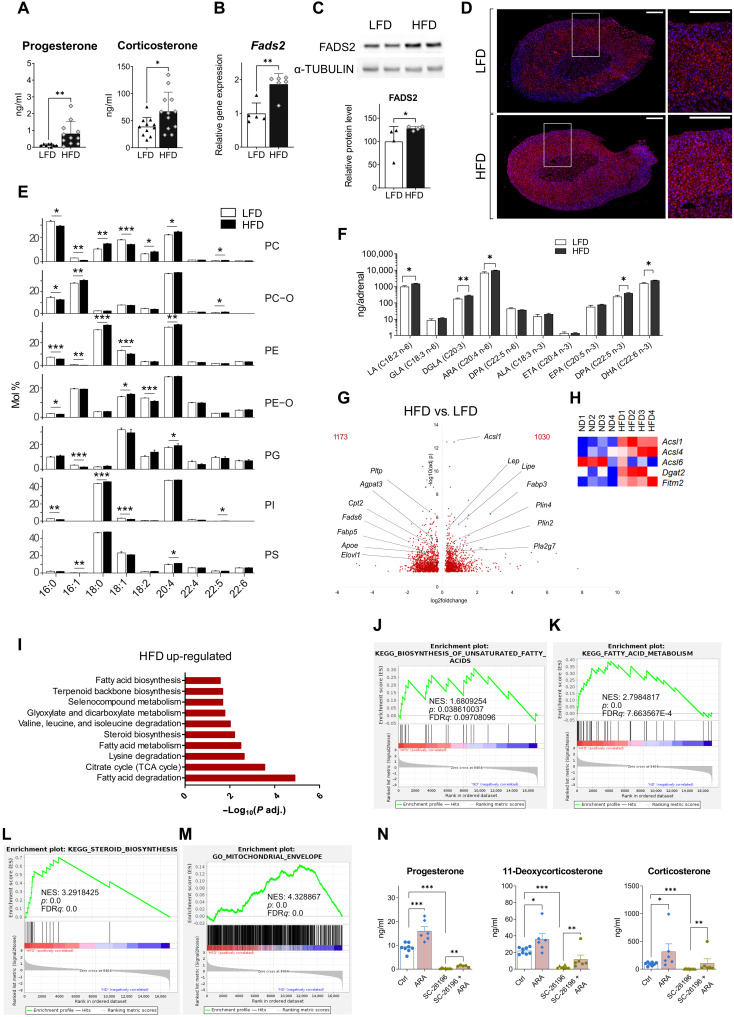
Fig. 2. HFD reprograms the adrenal lipidome and increases glucocorticoid production.
(A) Progesterone and corticosterone plasma levels in mice fed for 20 weeks a LFD or HFD (n = 8 to 12). (B and C) Fads2 mRNA expression (B) and protein expression (C) in adrenal glands of LFD and HFD mice (n = 4 to 6). (D) Immunofluorescence for FADS2 (red) and 4′,6-diamidino-2-phenylindole (DAPI; blue) in adrenal glands of LFD- and HFD mice (1 of 5 mice per condition). Scale bars, 200 μm, zoomed-in inserts are shown at the right. (E) Acyl chain profile of nonstorage lipids analyzed by shotgun lipidomics. Lipids in adrenal glands from lean and obese mice were grouped according to the acyl chain within each lipid class (mol % is relative to the lipid class). Only the features with a mean abundance >5 mol % are shown, mean mol % ± SD is shown (n = 7 to 8). (F) Acyl chain isomers in phospholipids in adrenal glands of LFD and HFD mice determined by HPLC-MS (n = 5 to 6). (G to M) RNA-seq in the adrenal cortex of LFD and HFD mice (n = 4 mice per group). Volcano plot showing differentially expressed genes in HFD versus LFD mice (G). Heatmap of differentially expressed genes involved in fatty acid processing (P adjusted < 0.05) (H). EGSEA of RNA-seq data in the adrenal cortex of HFD versus LFD mice showing 10 among most up-regulated metabolic pathways (KEGG database) (I). GSEA for genes involved in biosynthesis of unsaturated fatty acids (J), fatty acid metabolism (K), steroid biosynthesis (L), and mitochondrial envelope formation (M). NES, normalized enrichment score; FDR, false discovery rate. (N) Progesterone, 11-deoxycorticosterone, and corticosterone levels in supernatants of primary adrenal cell cultures treated for 18 hours with SC-26196 (10 μM) or DMSO (Ctrl) in the presence or absence of ARA (150 μM) (n = 6 to 8). Data in (A) to (C) are shown as mean ± SD and in (F) and (N) as mean ± SEM. *P < 0.05; **P < 0.01; ***P < 0.001.

