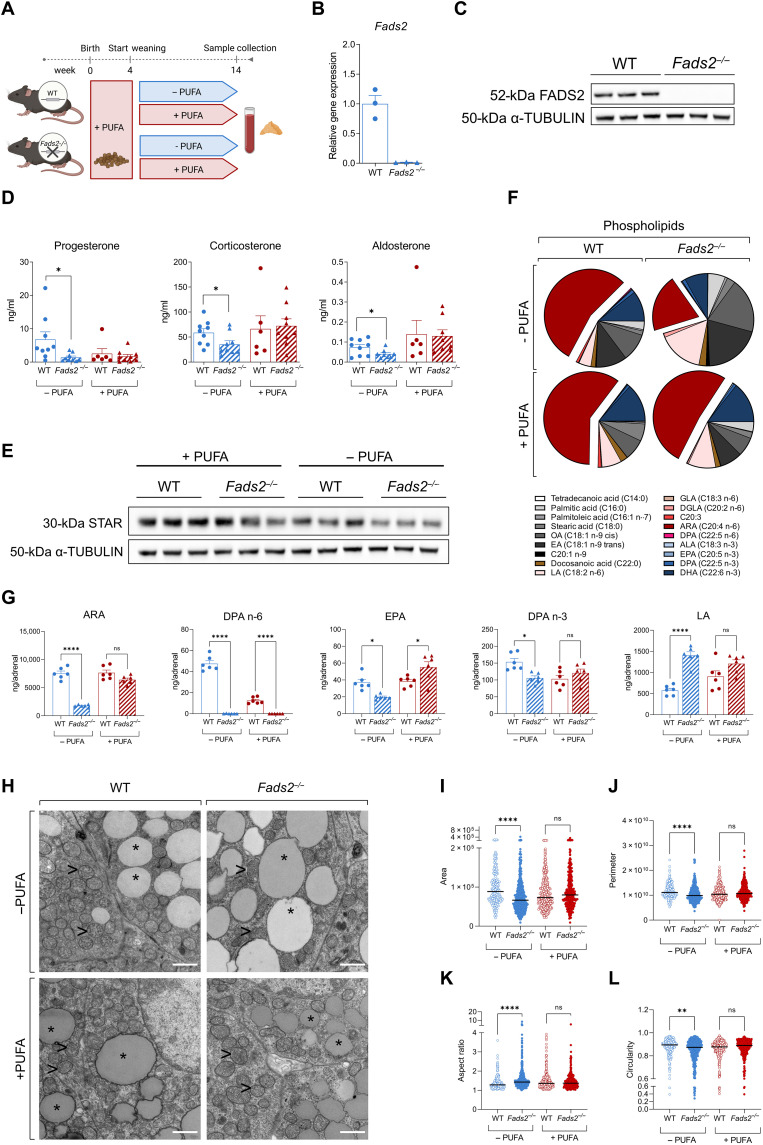
Fig. 6. FADS2 deficiency perturbs adrenal gland function.
(A) Scheme demonstrating the experimental setup. (B and C) FADS2 deletion efficiency in Fads2−/− mice. FADS2 expression was determined in adrenal glands of WT and Fads2−/− mice by qPCR using Tbp expression as a housekeeping gene (B) and Western blot using α-Tubulin as a loading control (C) (n = 3 mice per group). (D) Progesterone, corticosterone, and aldosterone levels in the plasma of WT and Fads2−/− mice fed a low-PUFA or PUFA-rich diet (n = 6 to 9 mice per group). (E) Western blot for StAR in adrenal glands of WT and Fads2−/− mice fed a low-PUFA or PUFA-rich diet. α-Tubulin was used as a loading control (n = 3 mice per group). (F and G) Acyl chain composition of phospholipids in the adrenal gland of WT and Fads2−/− mice fed a low-PUFA or PUFA-rich diet (n = 6 mice per group). Results are presented as % of all phospholipidic acyl chains (F) and as ng per adrenal gland (G). OA, oleic acid; EA, elaidic acid. (H) Representative electron microscopy images of adrenocortical cells; adrenal glands of two WT and two Fads2−/− mice fed a low-PUFA and 1 WT and 1 Fads2−/− mice fed a PUFA-rich diet were imaged (magnification 6,800x). Scale bars, 1 μM. Asterisks (*) depict lipid droplets, and arrowheads (>) depict mitochondria. (I to L) Quantification of mitochondrial area (I), perimeter (J), aspect ratio (K), and circularity (L) in WT and Fads2−/− mice fed a low-PUFA or PUFA-rich diet (in total, 198 to 429 mitochondria were quantified in two WT and two Fads2−/− mice fed a low-PUFA and one WT and one Fads2−/− mice fed a PUFA-rich diet). Data in (B), (D), and (G) are shown as means ± SEM. *P < 0.05; **P < 0.01; ****P < 0.0001.

