
Figure 3.
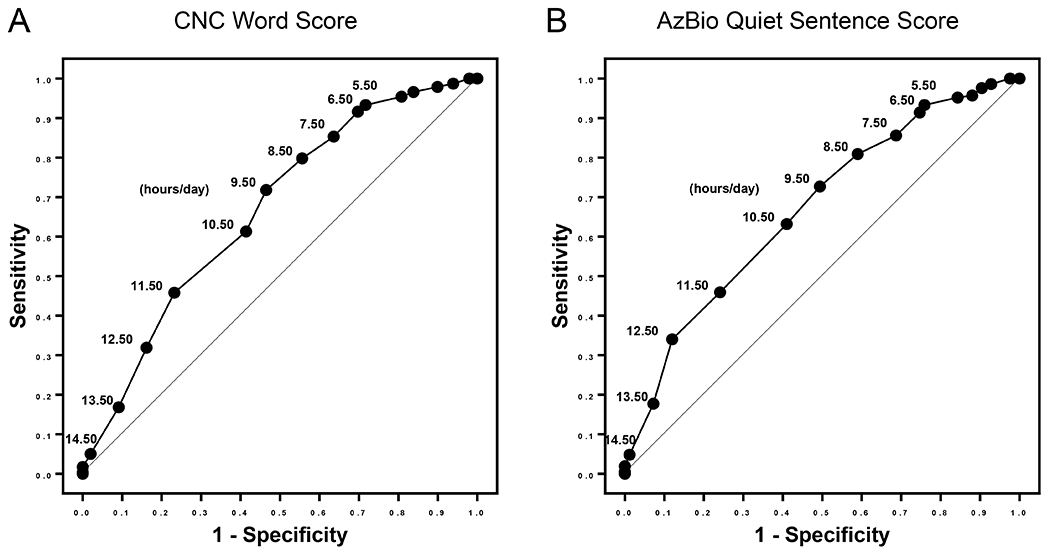
Receiver operating characteristic (ROC) curve analysis was performed to build classification models for both A) Benchmark achievement of CNC word score [area under the curve (AUC) = 0.67, 95% C.I.: 0.60 0.73, p < .001] and B) Benchmark achievement of AzBio Quiet sentence score (AUC: 0.67, 95% C.I.: 0.60, 0.74, p < .001). Sensitivity is shown on the y-axis, 1-specificity on the x-axis, and hour per day thresholds are marked on the corresponding points on the curve.