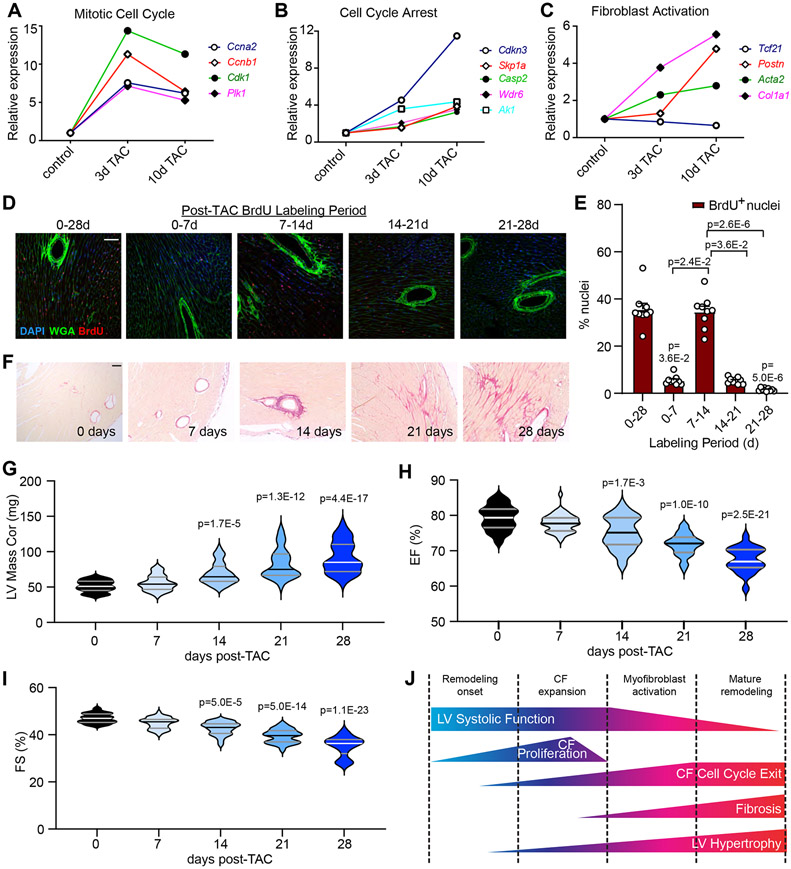
Figure 1. Acute transcriptional response of cardiac fibroblasts to left ventricle pressure overload.
A-C) Cardiac fibroblasts were isolated from C57BL/6J mice at baseline or at the indicated time after TAC surgery and subjected to RNA-sequencing18. Relative expression of select genes that indicate active cell cycle (A), cell cycle exit (B), and fibroblast activation (C). n=6 control; n=3 3-day TAC; n=3 10-day TAC. D) Mice were subjected to TAC surgery, and injected with BrdU for the indicated time periods prior to heart isolation at 28days post-TAC. Representative images of histological sections from hearts of indicated treatment stained with an antibody directed against BrdU (red), wheat germ agglutinin to mark cell membranes (WGA, green), and DAPI to mark nuclei (blue). E) Quantification of BrdU incorporation from (D) as a percentage of total nuclei. Data is represented as Mean +/− SEM. Data points indicate results from individual mice analyzed by Kruskal-Wallis test followed by Dunn’s test to calculate pairwise comparisons. n=9 per timepoint. F) Hearts were isolated from mice at the indicated timepoints post TAC and stained with Picrosirius Red to visualize collagen. G-I) Serial echocardiographic assessment of left ventricle (LV) mass (G), LV ejection fraction (EF%) (H), and LV fractional shortening (FS%) (I). Violin plots depict data distribution of n=40 individual mice per timepoint analyzed by Kruskal-Wallis test followed by Dunn’s test to calculate pairwise comparisons. J) Schematic describing the timing of various aspects of LV remodeling in pressure overload. Scale bar = 50μm (D), 100 μm (F).

