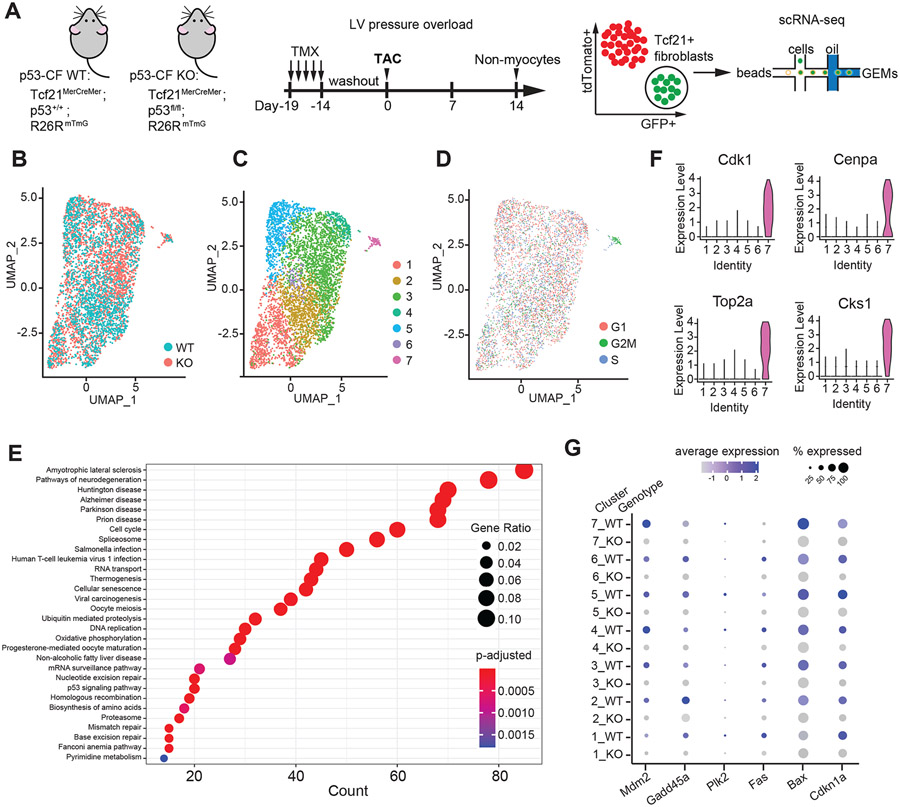
Figure 5. Single cell RNA-sequencing reveals highly proliferative population of cardiac fibroblasts.
A) Schematic indicating genotype of mice used in study, and experimental timeline of tamoxifen (TMX) injection, TAC surgery and Tcf21-lineage fibroblast isolation for single cell RNA-sequencing. B-D) Uniform Manifold Approximation and Projection (UMAP) of single Tcf21-lineage cell transcriptomes from p53-CF WT (1659 cells) and KO (3158 cells) mice obtained 14 days post-TAC, represented by genotype (B), cell identity (C) and cell cycle phase (D). Cluster 7 is defined by cells in G2/M phase of the cell cycle. E) Dot plot visualization of Gene ontology (GO) biological processes that are enriched in cluster 7, revealing p53-dependent neurological disorders, cellular senescence, and proliferation related processes. F) Expression of genes that define the highly proliferative cluster 7, depicted by violin plots. G) Dot plot visualization of gene expression for candidate p53 target genes sorted by genotype and cluster number. Color scale represents relative expression across all cells within a particular cluster, and size of dot represents the % of cells within cluster that express the indicated gene.

