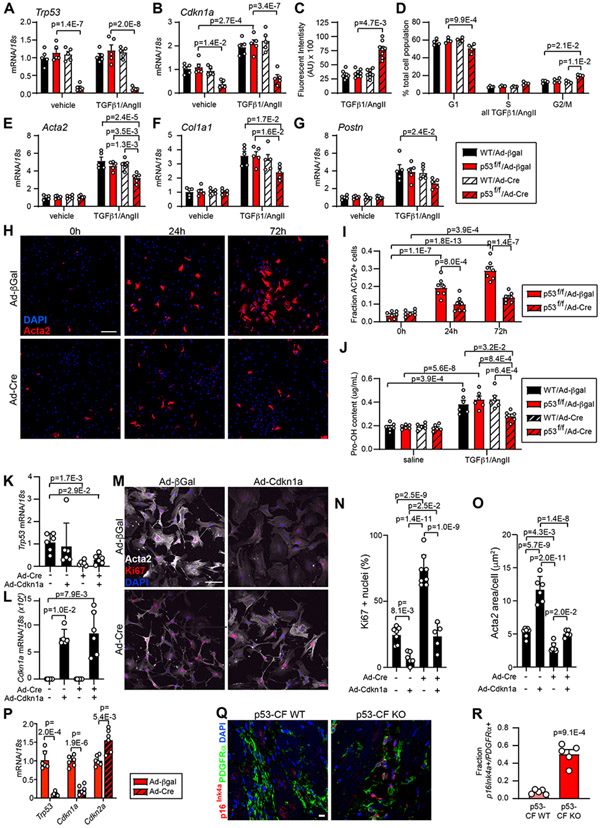
Figure 8. p53 deletion accelerates cardiac fibroblast cell cycle at the expense of myofibroblast activation.
Cardiac fibroblasts were isolated from WT or p53-fl/fl mice and treated with adenovirus directing the expression of β-galactosidase (β-Gal) or Cre-recombinase (Cre) for 24 hrs. Cardiac fibroblasts of indicated genotype and transduction were treated with vehicle or TGF-β1(10ng/mL)/AngII (1μM) for an additional 24 hrs (for RNA) or 72 hrs (for protein) prior to indicated assay. A, B) qRT-PCR reveals the expression of Trp53 (A) and Cdkn1a (B). C) Cardiac fibroblast proliferation was quantified by Cyquant assay. D) Cell cycle phase was determined by flow cytometry of propidium iodide-stained cells. E-G) qRT-PCR reveals the expression of Acta2 (E) Col1a1 (F) and Postn (G). H) Immunocytochemistry using an antibody directed against Acta2 (red) reveals activated myofibroblasts in p53–fl/fl cultures treated with TGF-β1 (10ng/mL)/AngII (1μM) and Ad/β-Gal or Ad/Cre for the indicated time. Nuclei are labeled with DAPI (blue). Scale bar = 50 μm. I) Quantification of Acta2 staining as a percentage of total cells shown in (H). J) Hydroxyproline incorporation assay reveals the relative level of collagen (Pro-OH content) in the conditioned media. K - O) Cardiac fibroblasts were isolated from p53-fl/fl mice and treated +/− Ad/Cre +/− Ad/Cdkn1a, followed by stimulation with TGF-β1(10ng/mL)/AngII (1μM) for 72 hours to induce myofibroblast activation. qRT-PCR reveals the expression of Trp53 (K) and Cdkn1a (L). Immunocytochemistry revealed Acta2+ stress fibers (white), Ki67+ proliferating cells (red), and nuclei (DAPI, blue) (M). Ki67+ nuclei (%) was quantified in (N) and Acta2+ area/cell is quantified in (O). Scale bar in (M) = 100 μm. P) p53 was deleted by Ad/Cre treatment 72 hrs after myofibroblast activation with TGF-β1(10ng/mL)/AngII (1μM). 24 hrs later, RNA was isolated and qRT-PCR was performed to investigate expression of indicated genes. Q) Heart sections obtained from mice of indicated genotype 28 days post-TAC were incubated with antibodies directed against PDGFRα (fibroblasts, green) and p16Ink4a (red). DAPI labels nuclei (blue). Scale bar = 10 μm. R) Quantification of PDGFRα / p16Ink4a double positive cells in (Q). Datapoints indicate results of individual biological replicate cell culture well or individual mouse. Data is represented as Mean +/− SEM. Data is analyzed by Kruskal-Wallis test followed by Dunn’s test to calculate pairwise comparisons (C, K, L, M, O); or by two-way repeated measures ANOVA with Geisser-Greenhouse correction (A, B, D, E, F, G, I, J); or by unpaired, two-tailed t-test with Welch’s correction (P, R).

