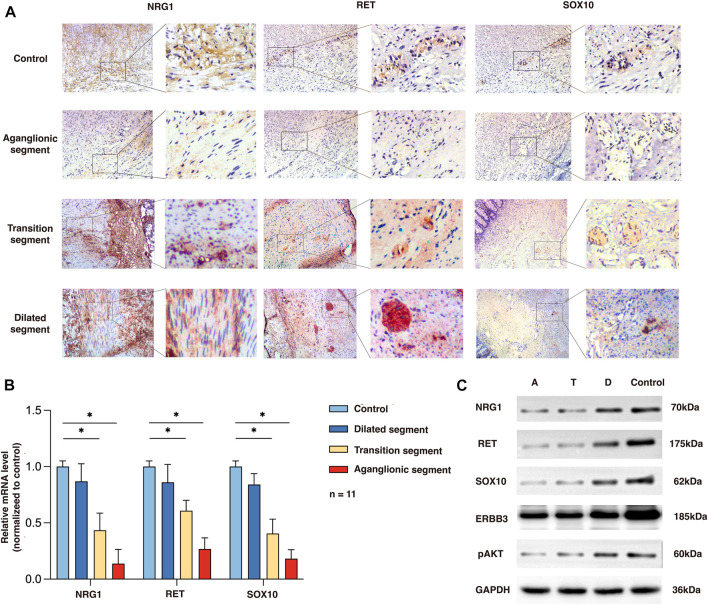
FIGURE 2.
Expression of NRG1, RET, and SOX10 in the rs2439302 GG rs2435357 TT HSCR patients’ colon and control colon. (A) Immunochemistry staining in colon tissues for NRG1, RET, and SOX10. (B) qRT-PCR analysis of relative expression levels of NRG1, RET, and SOX10. (C) Western blot of protein expression levels of NRG1, RET, SOX10, ERBB3, pAKT, and GAPDH in aganglionic, transition, and dilated segments of HSCR patients and control.

